
App Analyzer
App Analyzer is a tool that delivers a comprehensive audit of an app in a few clicks. You can choose any app for analysis, your own and competitor's.
App Analyzer allows you to evaluate the chosen app based on several criteria, including:
- Install numbers
- Visibility
- App rating
- Localization, and a lot more
This way, you can analyze your or other devs' approach to their products along with the results this approach brings.
Why to use: Analyze an app's efficiency using key metrics to audit performance and gain information for improving your App Store Optimization (ASO) strategy.
Goal: Provide a detailed app performance overview.
Time: Up to 10 minutes
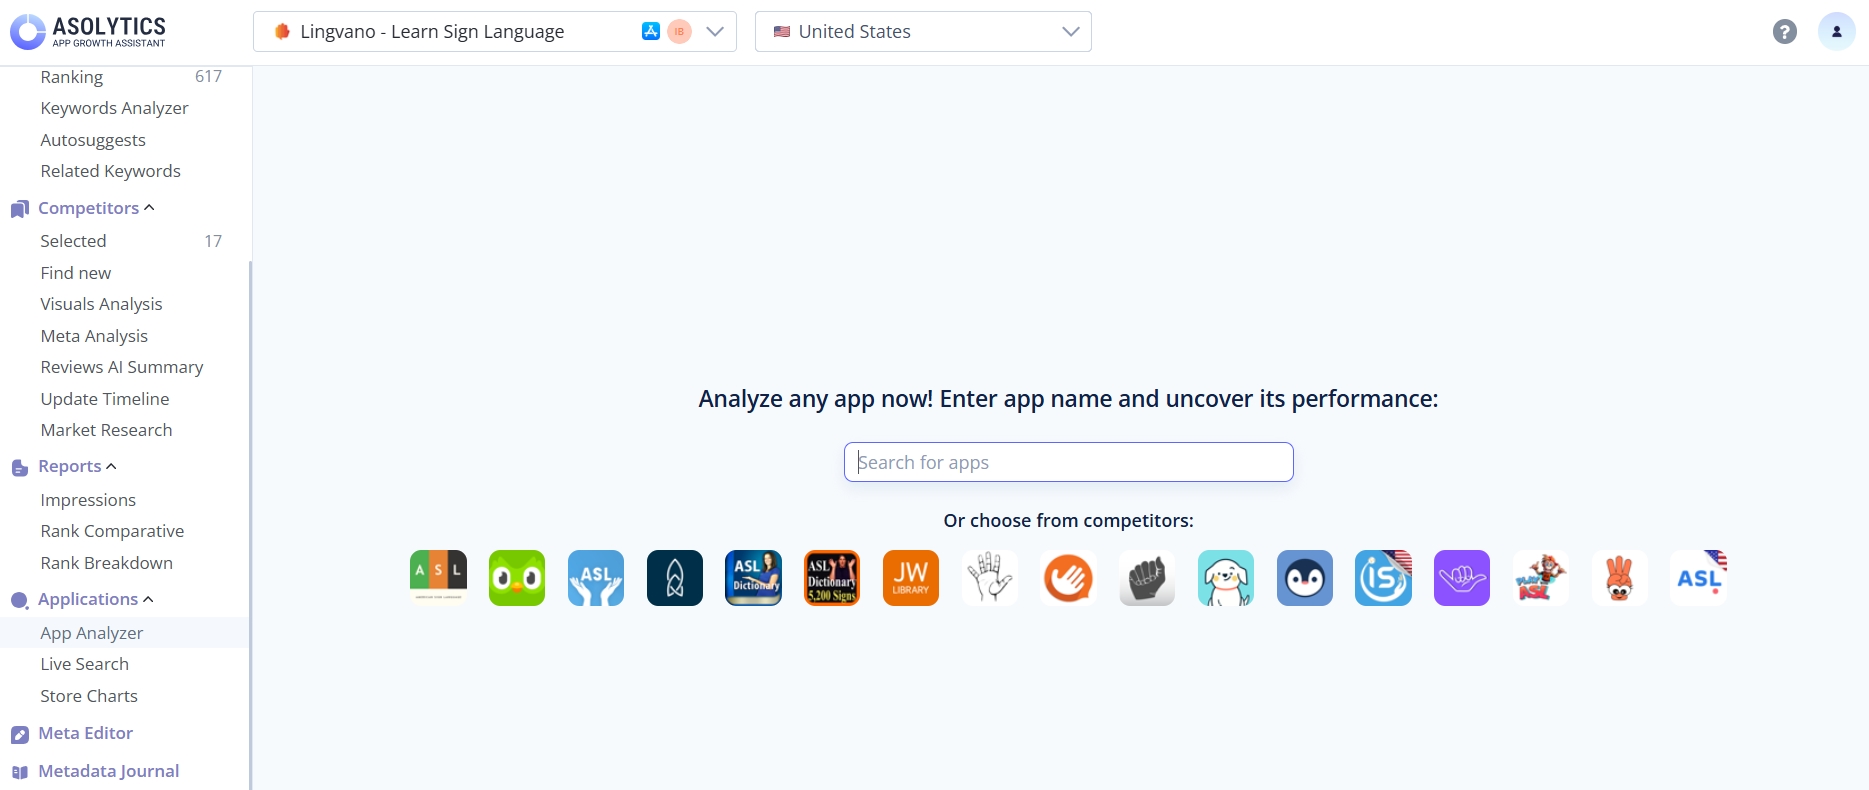
1. Choose an App
Type the app's name into the search bar or select it from your competitor list under the bar.
Once selected, you'll immediately see a page with full information about the app. At the top of this page, you'll find:
- The app's name and logo
- The ASO score, showing how well the app is optimized (0–100)
- A link to open the app in the App Store or Google Play
- Buttons to mark the app as a direct competitor, indirect competitor, or non-competitor
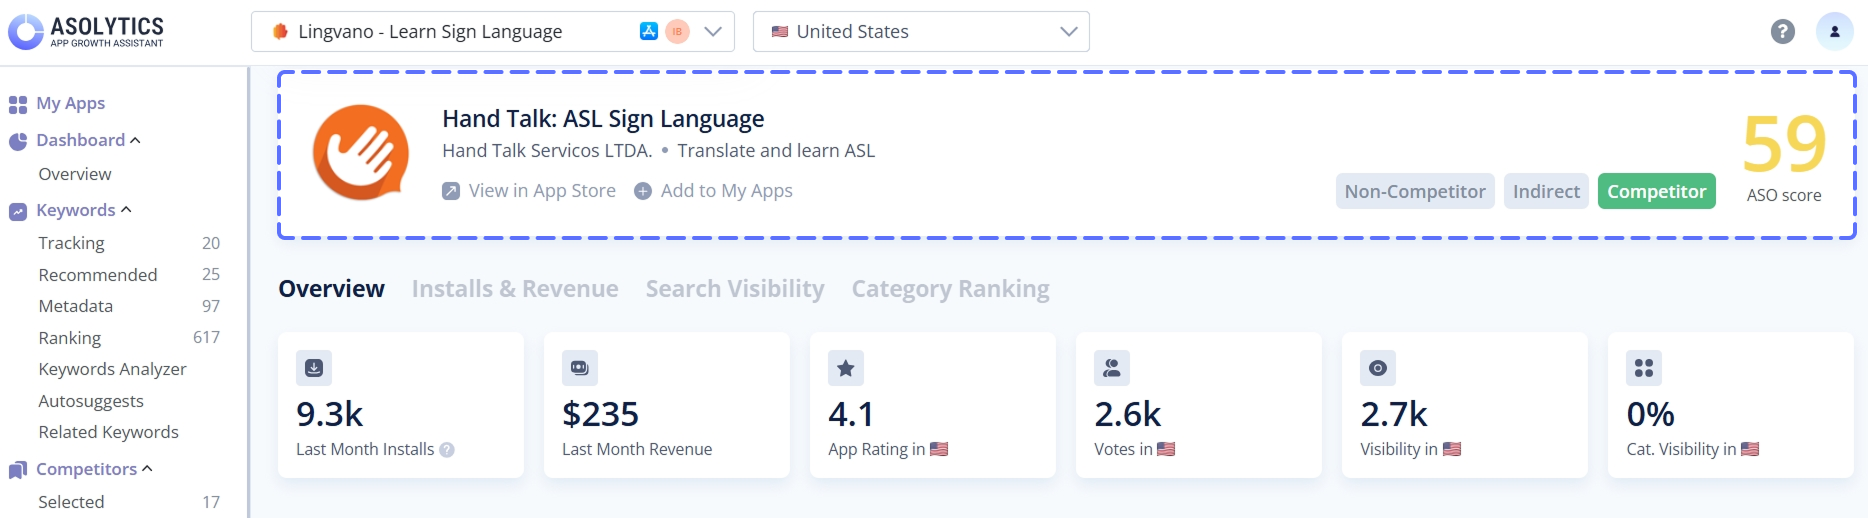
Below this basic information, you'll find 4 tabs – Overview, Installs & Revenue, Search Visibility, and Category Ranking – with more detailed insights.
Let's start by exploring the Overview tab.
2. Examine App's Metrics
The Overview tab provides the fundamental metrics for your chosen app:
- Last month's installs. Here, you can see how many times users downloaded and successfully opened the app for the first time during the last month.
- Last month's revenue. This metric shows how much the app earned over the past month from all monetization sources. These may include in-app purchases, subscriptions, ads, etc. It helps you understand the app's financial performance and identify revenue trends over time.
- App rating in the chosen country. It's the average user rating on a scale from 1 to 5. This figure provides an overall indication of user satisfaction and the app's quality.
- Votes in the chosen country. Here, you may check the total number of user reviews or ratings received by the app. This metric helps assess the level of user engagement and provides insights into the app's popularity.
- Visibility in the chosen country. This parameter measures the app's visibility and prominence within the chosen country's market. It indicates how easily users can discover the app in the app stores. Higher visibility generally leads to stronger organic growth and more user acquisitions.
- Category visibility in the chosen country. It assesses the app's prominence within its specific category. Higher category visibility helps attract relevant users.
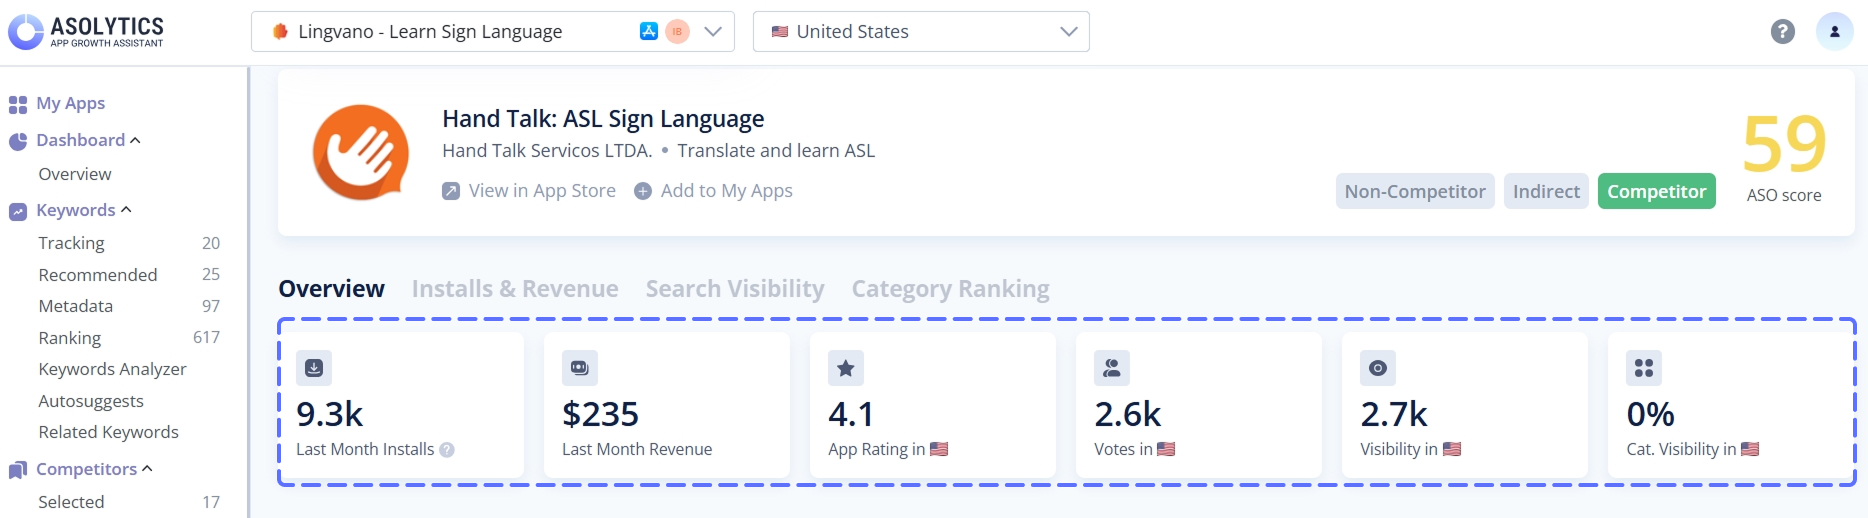
You can view market-specific data for any country. To change the country, simply use the dropdown in the page header.
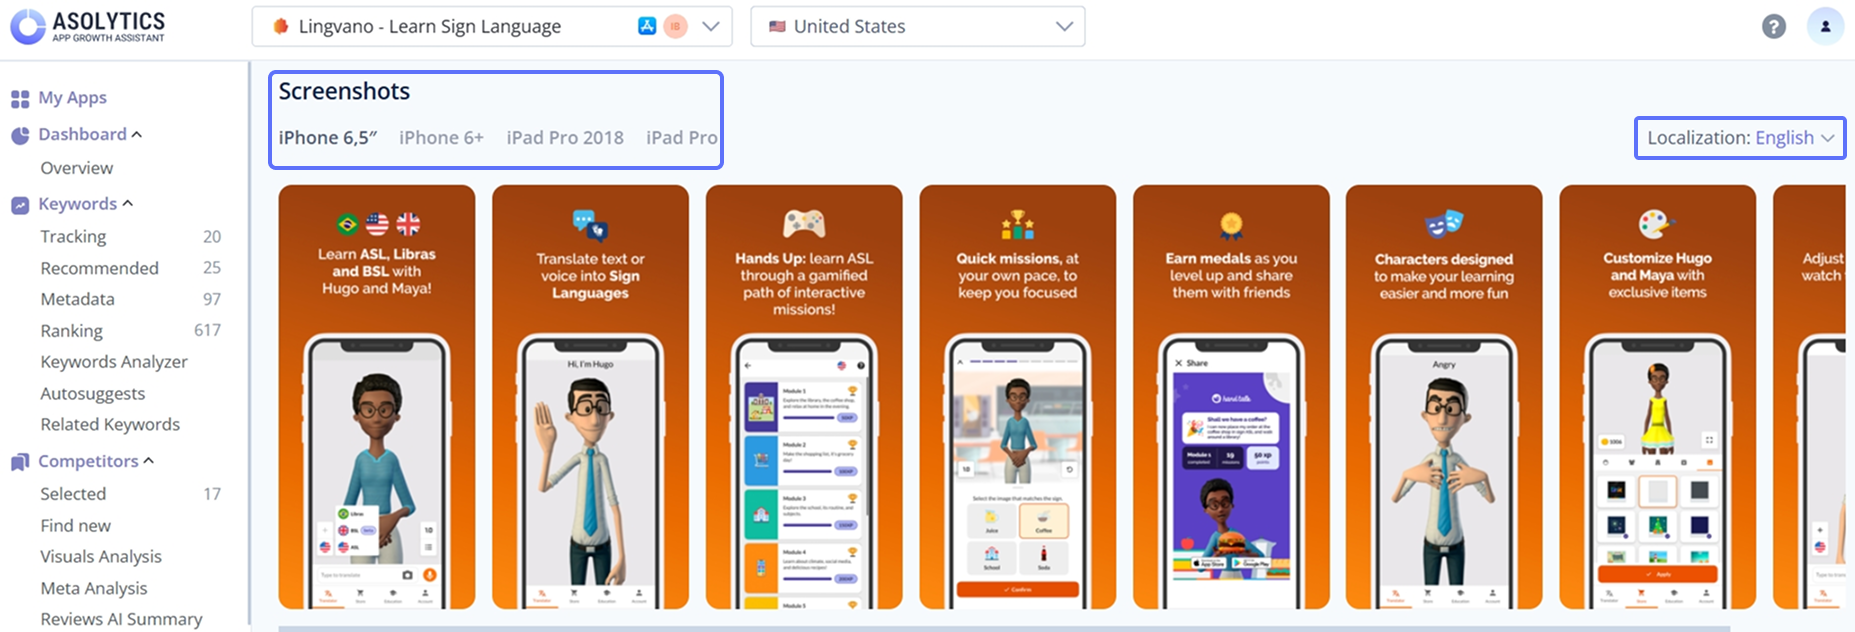
3. Study Screenshots and Text Metadata
Below the metrics, you'll find the app's screenshots and metadata. For App Store apps, you can view screenshots for various device types, including different iPhone and iPad versions. You can also switch between available screenshot localizations using the dropdown on the left.
Next, review the app's text metadata. The Text Metadata section presents a compact table showing how the app is described across its top countries. This information is useful for understanding how other developers position their apps in different markets – what titles, subtitles, and descriptions they use, and how their messaging varies by locale.
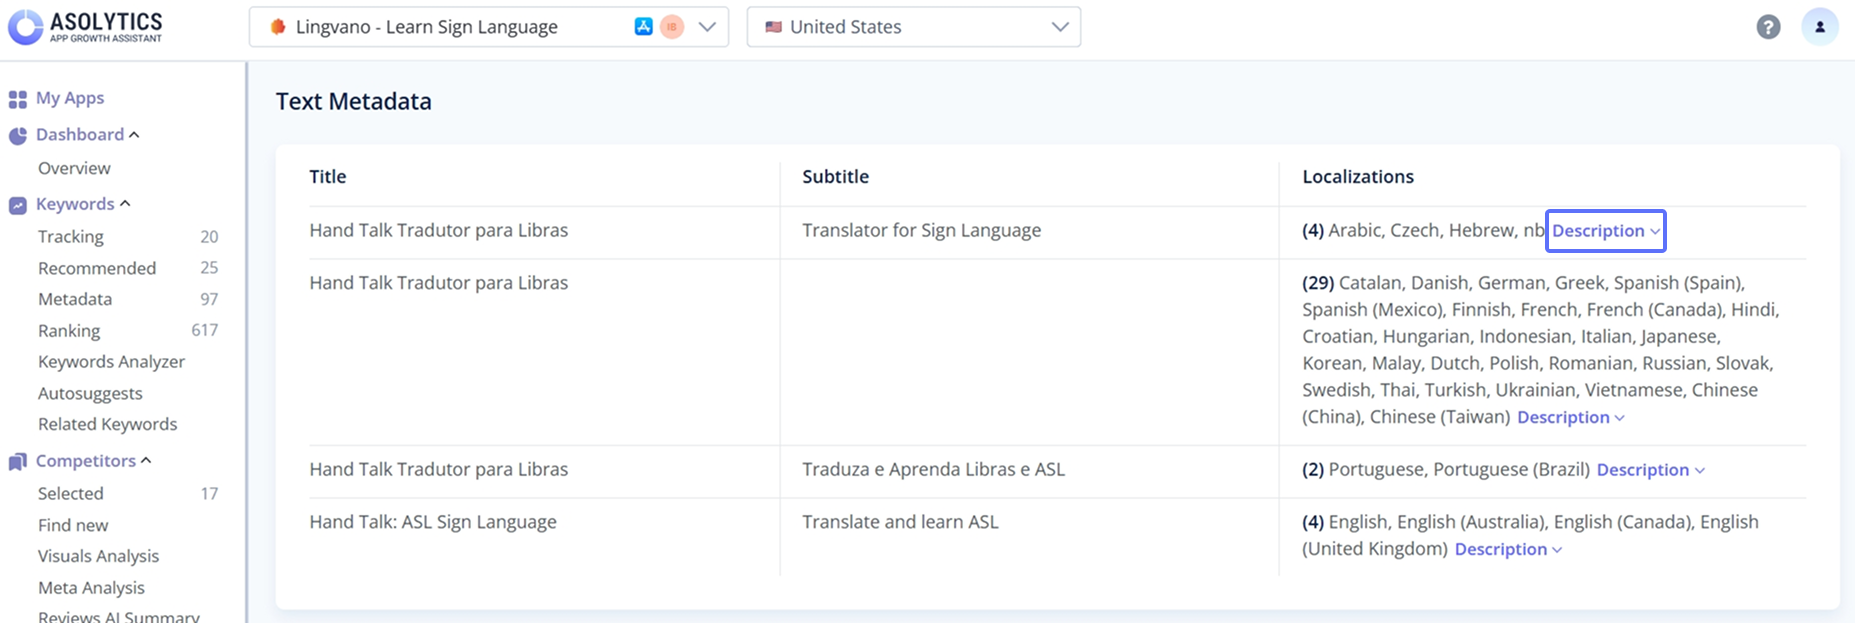
You can view the full description for any specific localization by clicking the corresponding link. Later, you'll be able to create or refine your own metadata for different countries and languages using the Meta Editor. But for now, this section simply helps you explore how the analyzed app presents itself globally.
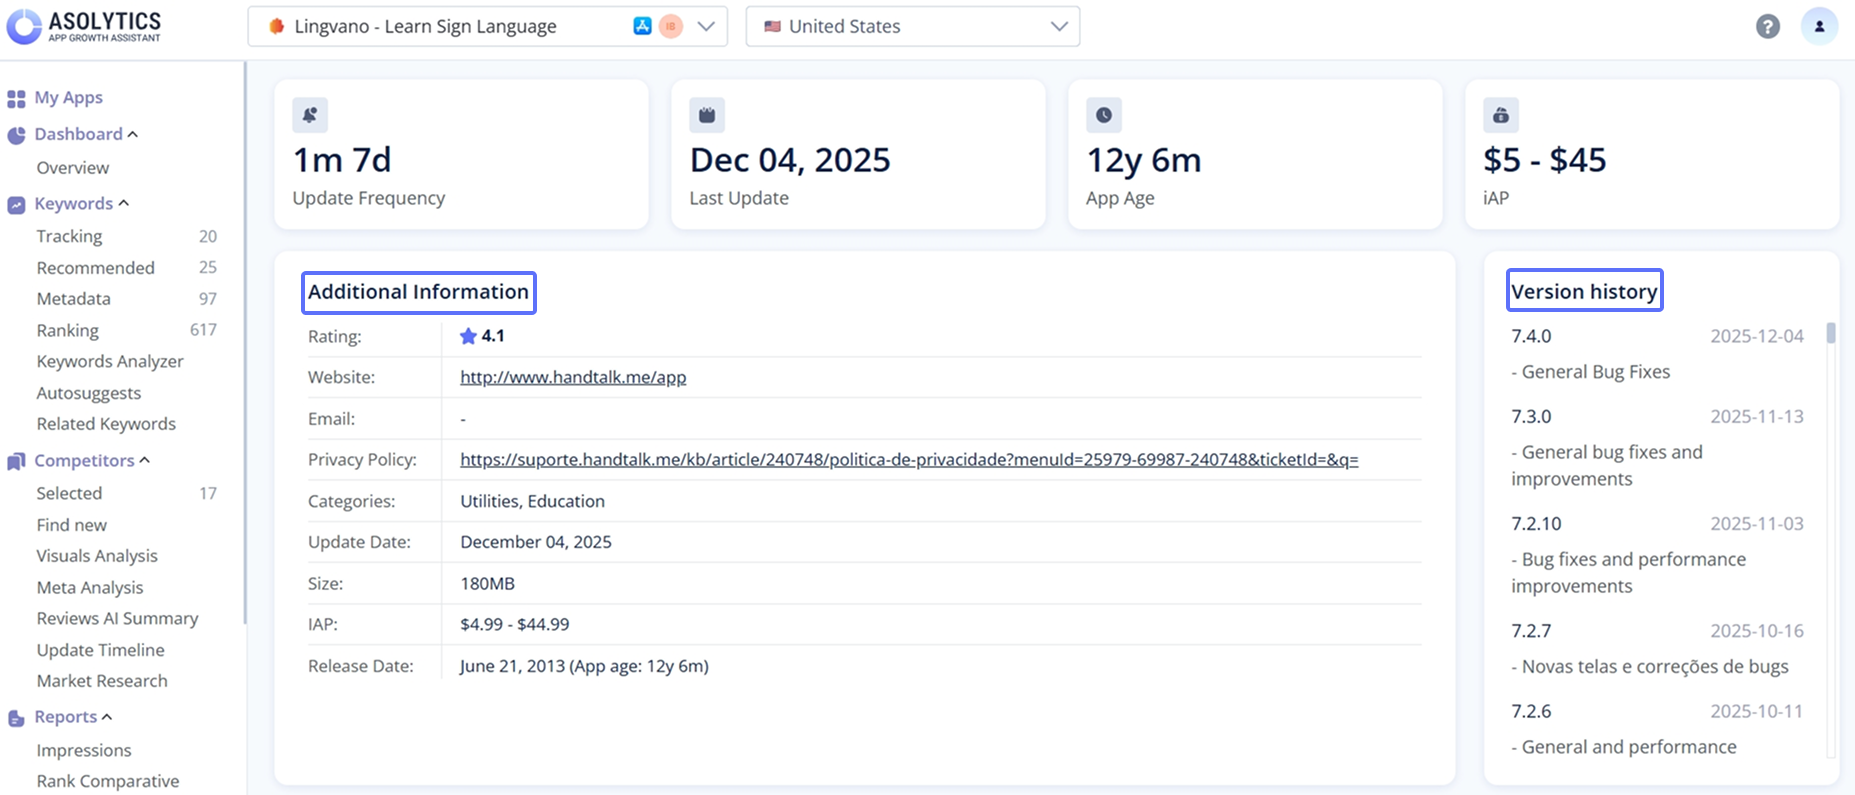
4. Review Store Details and Additional Information
Below the screenshots and metadata, you'll find a detailed block of store-related information that helps you assess the app's maintenance and stability. This section includes several key indicators:
- Update frequency that shows how often the app is updated. Regular updates typically signal active development and ongoing product improvement.
- Last update displaying the most recent date the developer released an update.
- App age that indicates how long the app has been available on the store. It helps you understand its lifecycle and maturity.
- In-app purchase (IAP) price range is a parameter that shows the minimum and maximum prices of available in-app purchases.
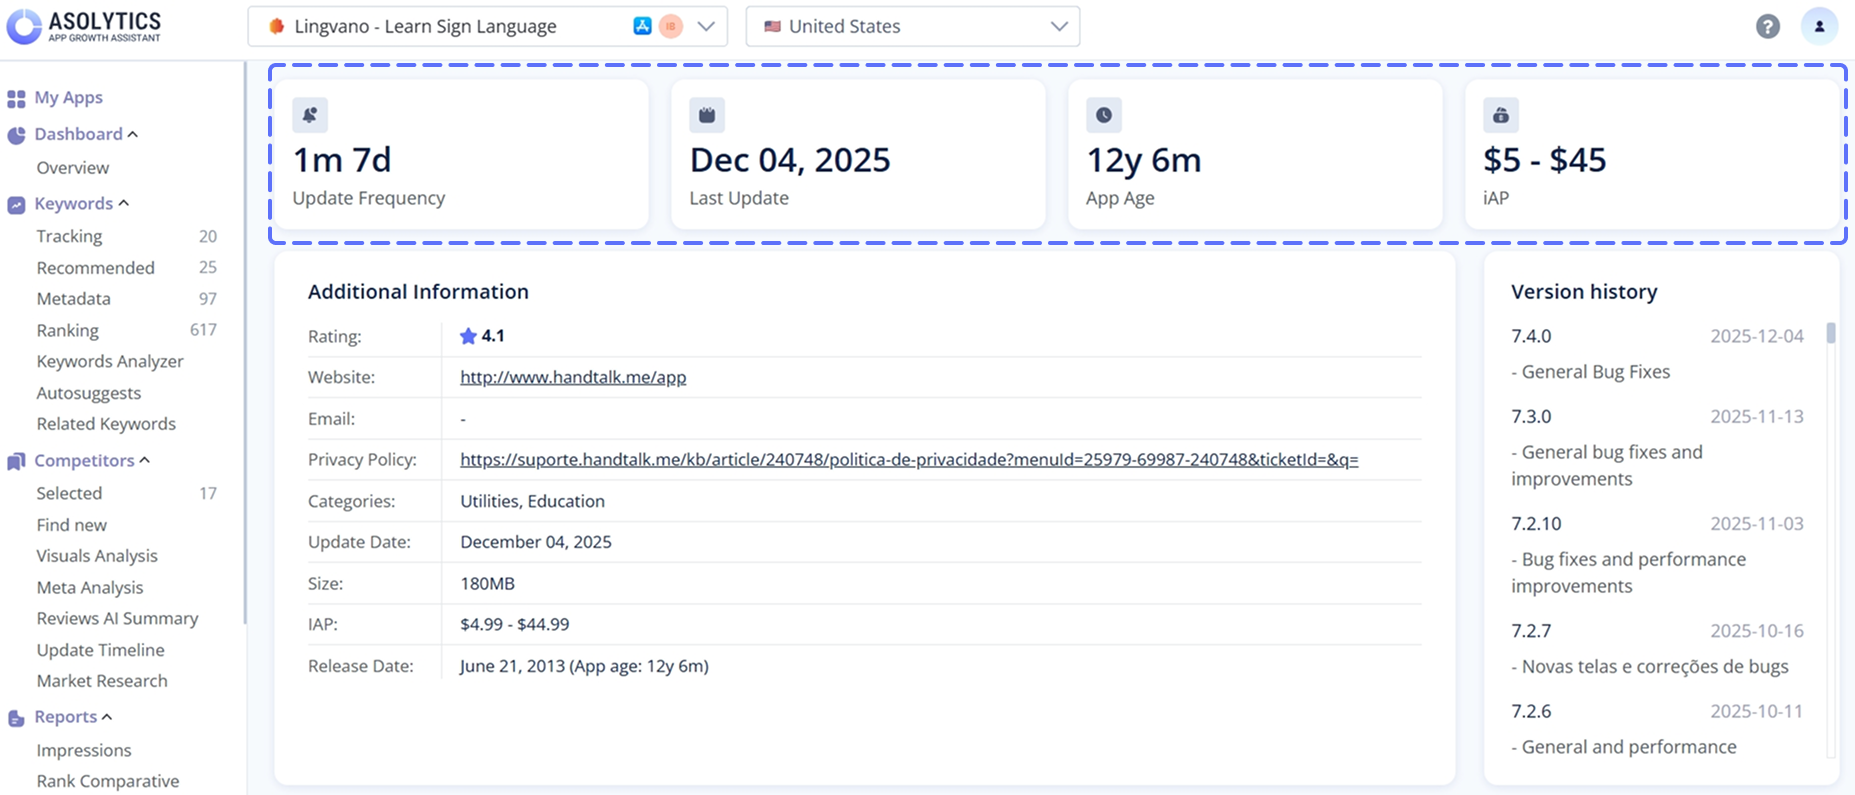
Further down the page, there is an Additional Information panel. This section summarizes various store attributes, such as:
- Rating
- Website link
- Privacy policy
- Categories
- Update date
- App size
- IAP pricing
- Release date
To the right, you'll see the Version History, which lists recent app versions along with their release dates and update notes. This helps you track how actively the developer maintains the product and what types of improvements or fixes have been released over time.
5. Explore Installs & Revenue Tab
The Installs & Revenue tab provides a historical view of the app's financial performance and user acquisition patterns. This is where you analyze trends and velocity. The tab consists of 2 main sections:
Estimated Installs & Revenue Chart
This section presents several key metrics:
- Total estimated installs worldwide over the past 12 months
- Estimated revenue worldwide over the past 12 months
- Estimated installs in the selected country over the past 12 months
- Estimated revenue in the selected country over the past 12 months
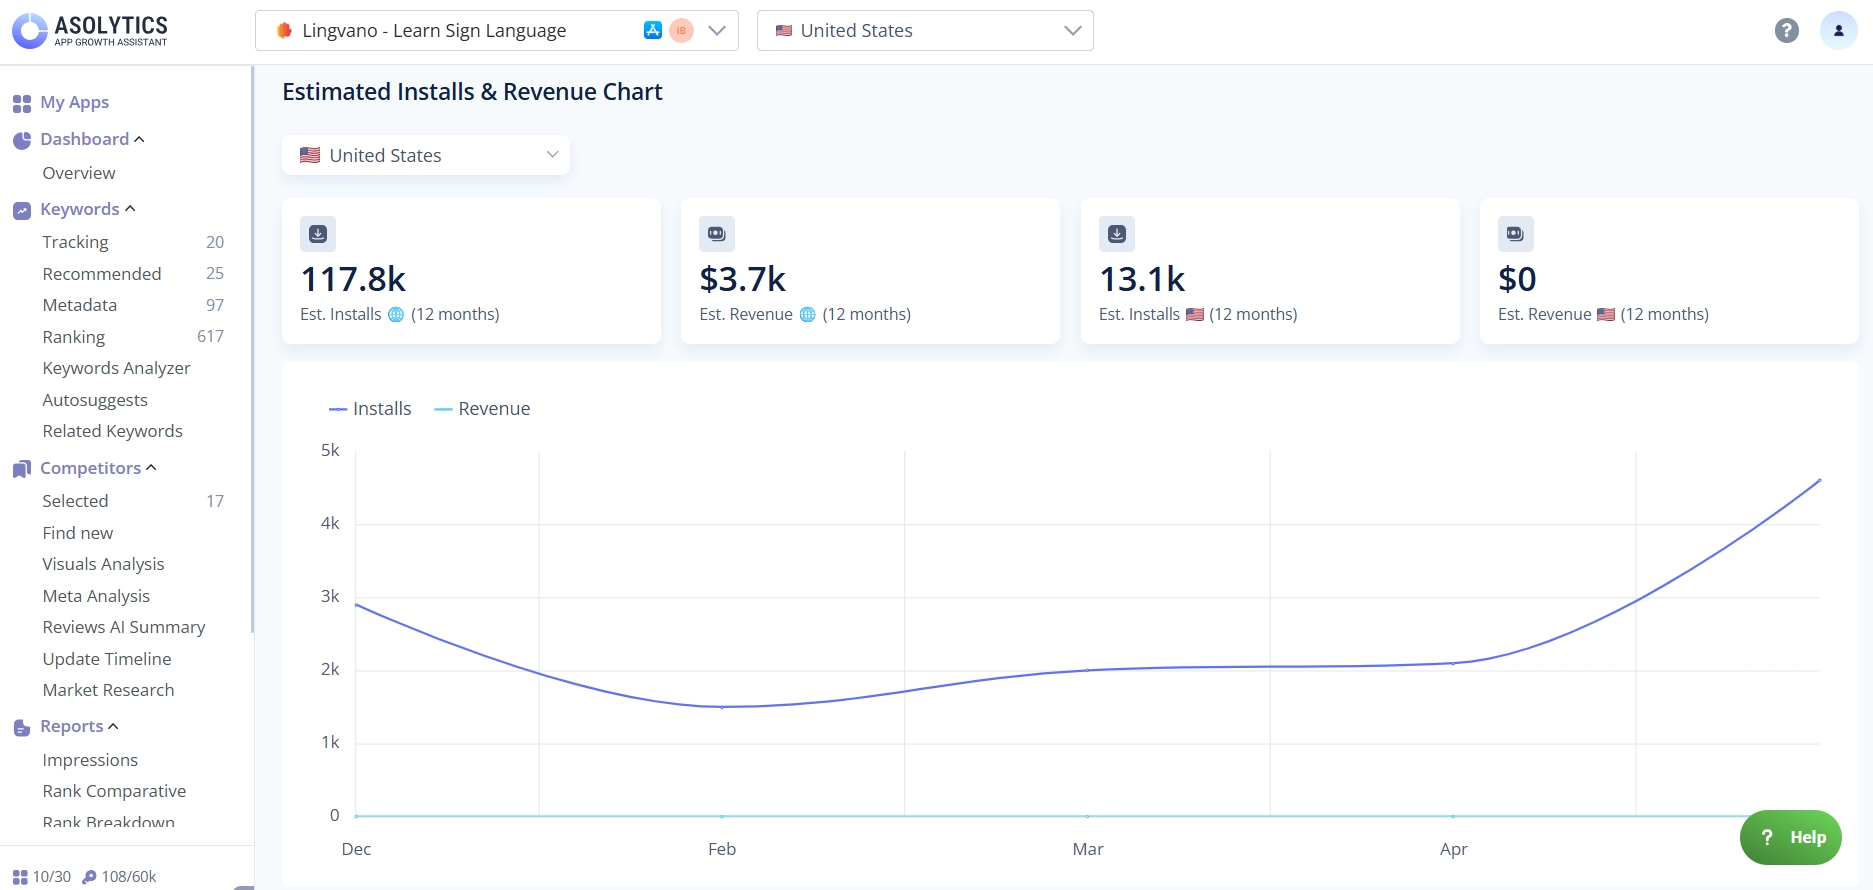
Below these metrics, a dynamic chart visualizes the trends in installs and revenue over the last year for the chosen market. Hover over a specific month to see the exact number of installs and revenue for that month. To change the country, use the dropdown above.
Previous Month's Estimated Installs & Revenue
Next, you can focus on the app's estimated performance for the previous month. This section displays the same set of metrics as the previous one, highlighting installs and revenue for the most recent month.
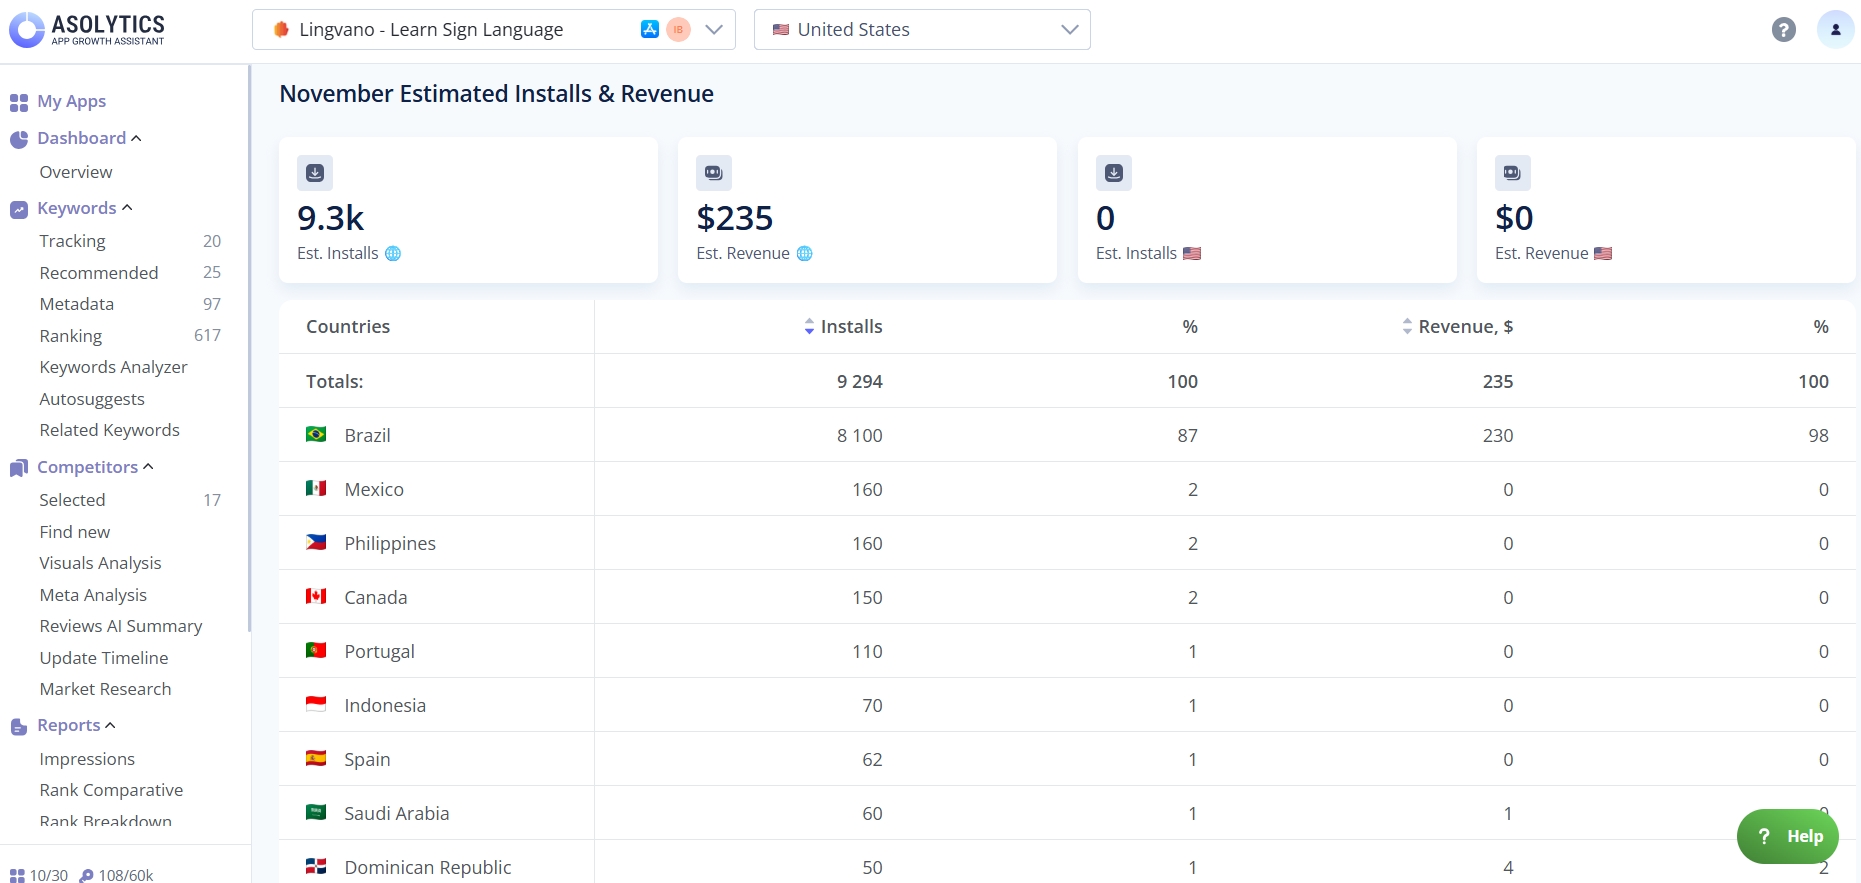
Additionally, a detailed table breaks down performance by country, showing:
- Country name
- Number of installs in that country
- Percentage of total installs
- Revenue generated in that country
- Percentage of total revenue
Click Show More to see the full table.
6. Analyze Search Visibility
Go to the Search Visibility tab to examine how well your app performs in search results within the selected country. This section helps you understand your keyword coverage, ranking strength, and how your visibility is evolving over time.
Metrics
In this tab, you'll see the following metrics:
- Total Keywords. This metric shows the total number of keywords your app ranks for in the selected country. It reflects the breadth of your keyword footprint. A higher number means your app appears in search results for more queries.
- Visibility. It is a combined metric based on estimated keyword Popularity and your App Rank. Ranking well for high-popularity keywords results in higher visibility. For example, an app with a visibility score of 10000 is far more likely to be noticed than one with a score of 1000. It means that the latter ranks for less popular or lower-impact keywords.
- Rank Up. This list highlights the keywords where your ranking improved the most during the selected period. For each keyword, you can see the ranking change (e.g., +30) and the current ranking position. It helps you identify high-performing keywords gaining traction.
- Rank Down. This section shows the keywords where your rankings declined the most. You can see how many positions you lost and your current rank for each affected keyword. It's a useful indicator for keywords that may require optimization or review.
- Keyword Movements. This section highlights how your keyword rankings have changed between two dates. Here, you can see:
- New – Total keywords your app now ranks for that it didn't rank for previously.
- Improved – Number of existing keywords where your ranking position has moved up.
- Decreased – Quantity of keywords where your ranking position has dropped.
- Dropped Out – How many keywords your app no longer ranks for.
- Keyword Breakdown. In this section, you'll check the distribution of your keyword rankings across different ranking ranges (Top 1 to Top 20). This breakdown shows how strong and competitive your keyword positions are.
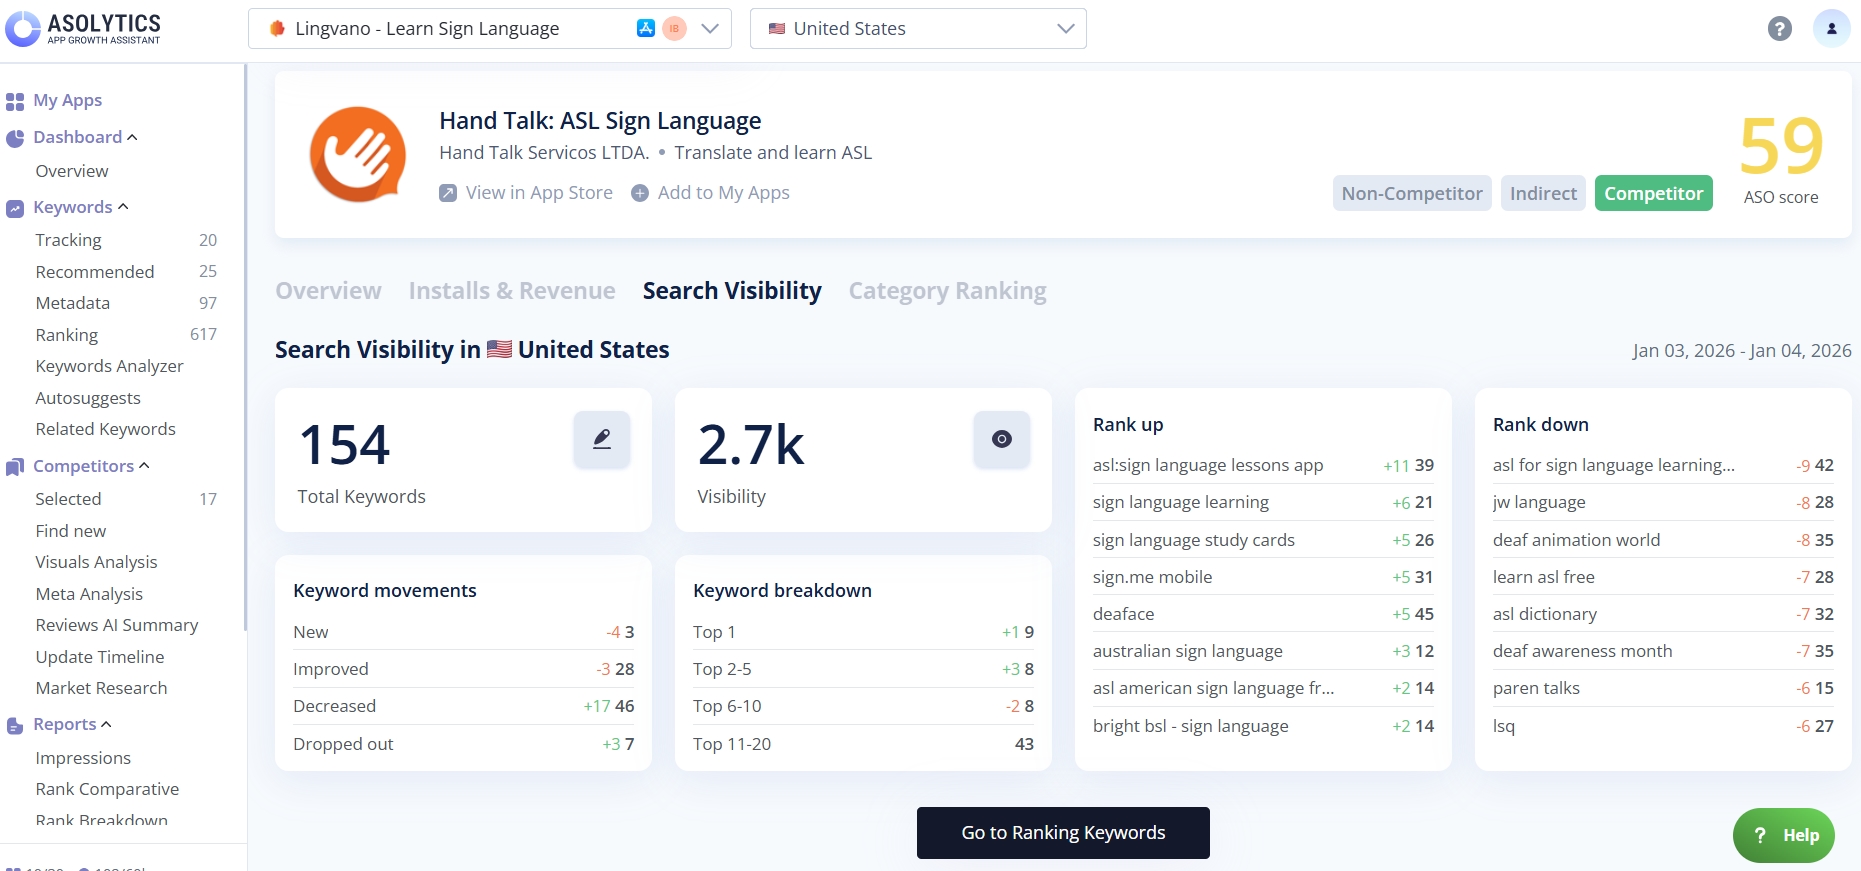
For more detailed keyword data, click the Go to Ranking Keywords button and open the full version of the Ranking Keywords tool.
Charts
Below the metrics, you'll find the Impressions Stats section. It shows how often your app appears in an app store search results and how these impressions are distributed across keywords and ranking positions. This section includes two charts:
- Estimated Impressions
- Rank Breakdown
The dropdowns above the charts let you choose the market and the time frame.
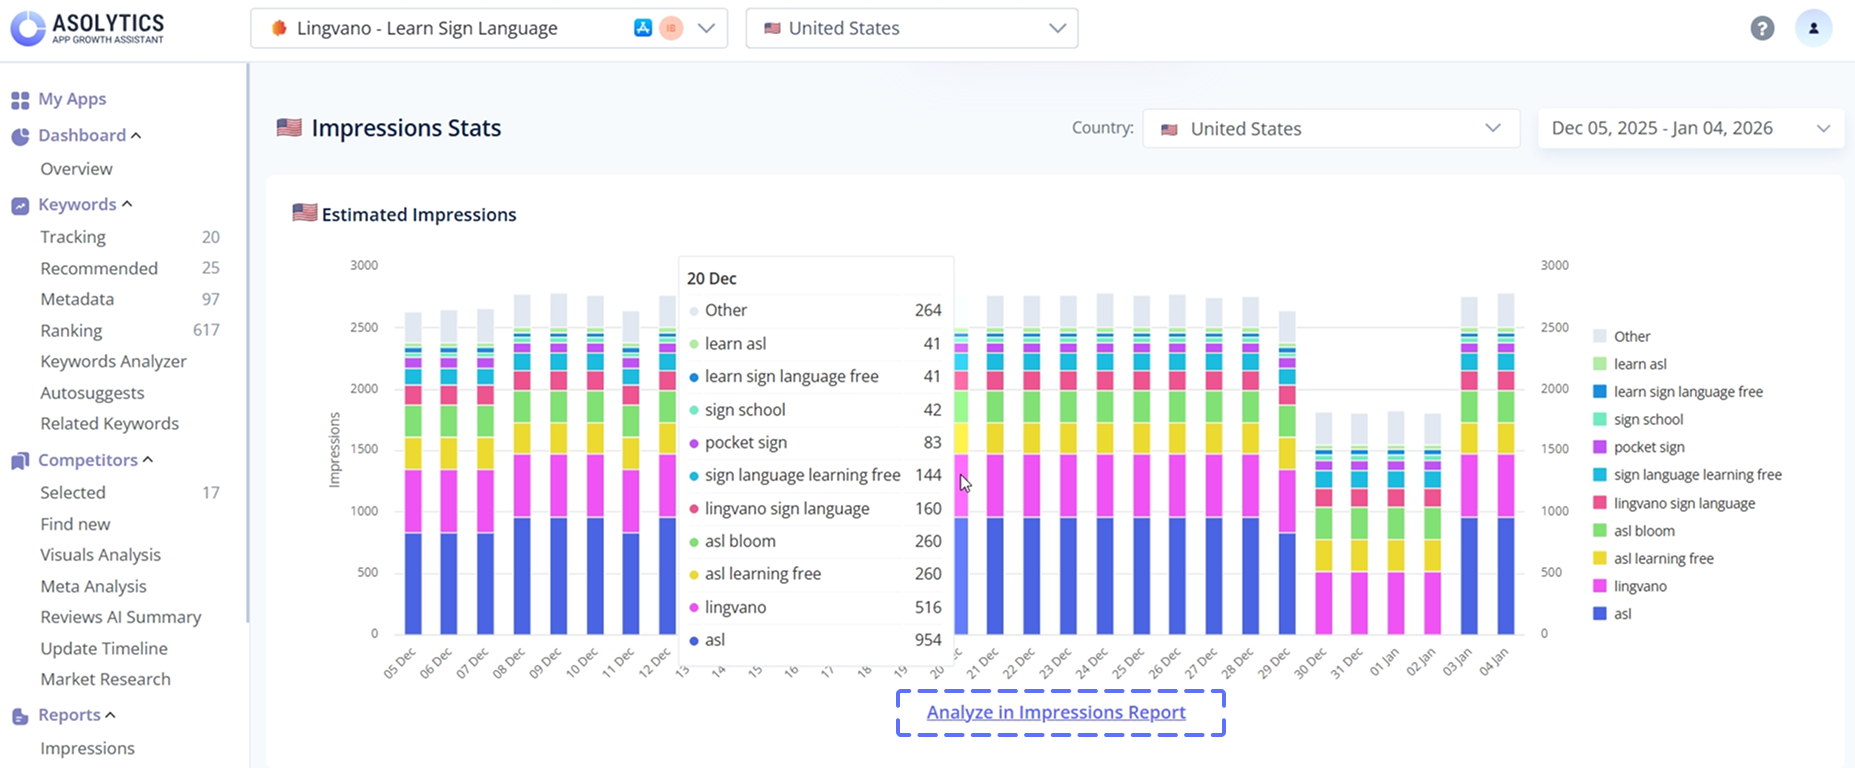
The Estimated Impressions chart displays the estimated daily impressions your app receives in the selected country during the chosen period. Each bar represents a day, with color segments showing how different keywords contribute to your visibility. It helps you track changes in visibility, identify spikes or drops, and understand which terms drive the most impressions. For a deeper breakdown, click Analyze in Impressions Report.
The Rank Breakdown chart shows how impressions are distributed across ranking tiers. Each day's bar is segmented by ranking groups, from Top 1 to Top 50. It helps you see which ranking ranges generate the most visibility and how shifts in ranking positions affect daily impressions.
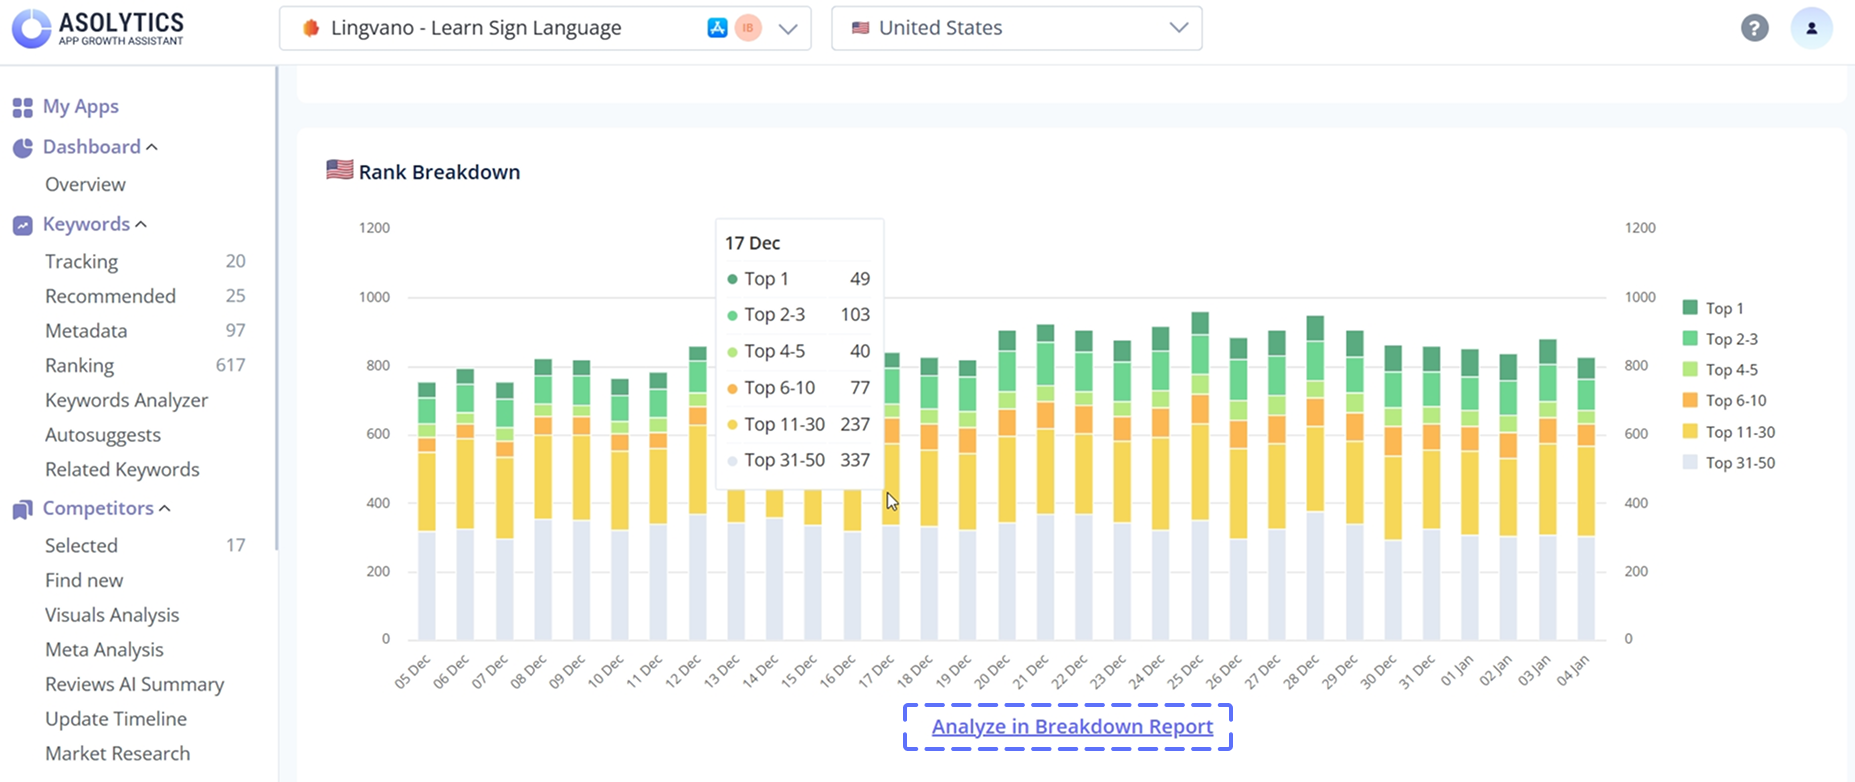
More details are available via the Analyze in Breakdown Report link.
7. Check Category Ranking
The Category Ranking tab shows how your app performs across different app store categories, devices, and countries. This section helps you understand your app's global ranking presence and how it shifts over time. It consists of several parts:
# of Ranking Countries
At the top of the tab, you'll see three charts showing how many countries your app ranked in Top 1, Top 10, and Top 50 as of the previous day. Each chart includes a line graph illustrating how these counts have changed over the past month.
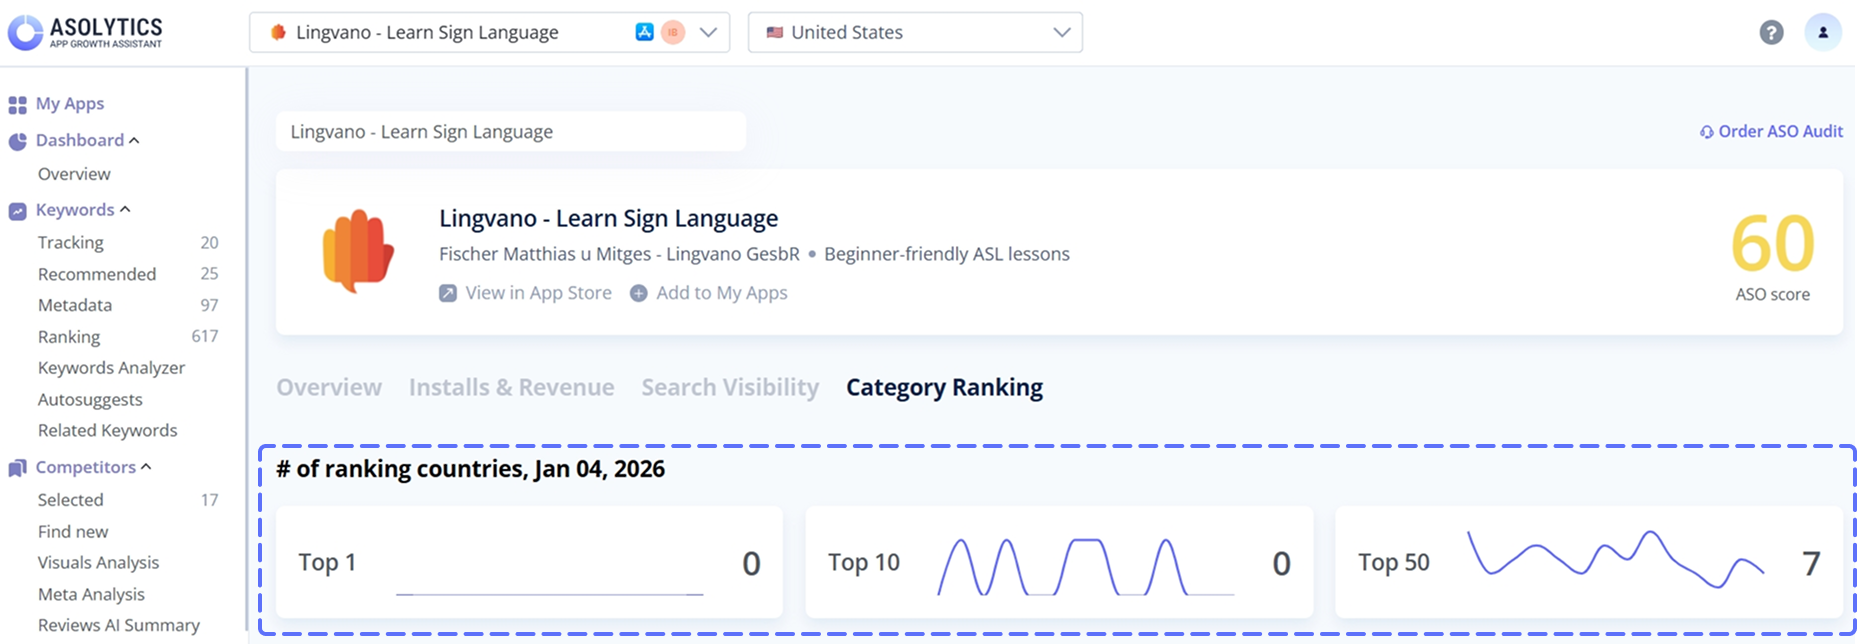
You can hover over any point on the line to view the exact number of countries where your app held a Top 1, Top 10, or Top 50 position on that specific date.
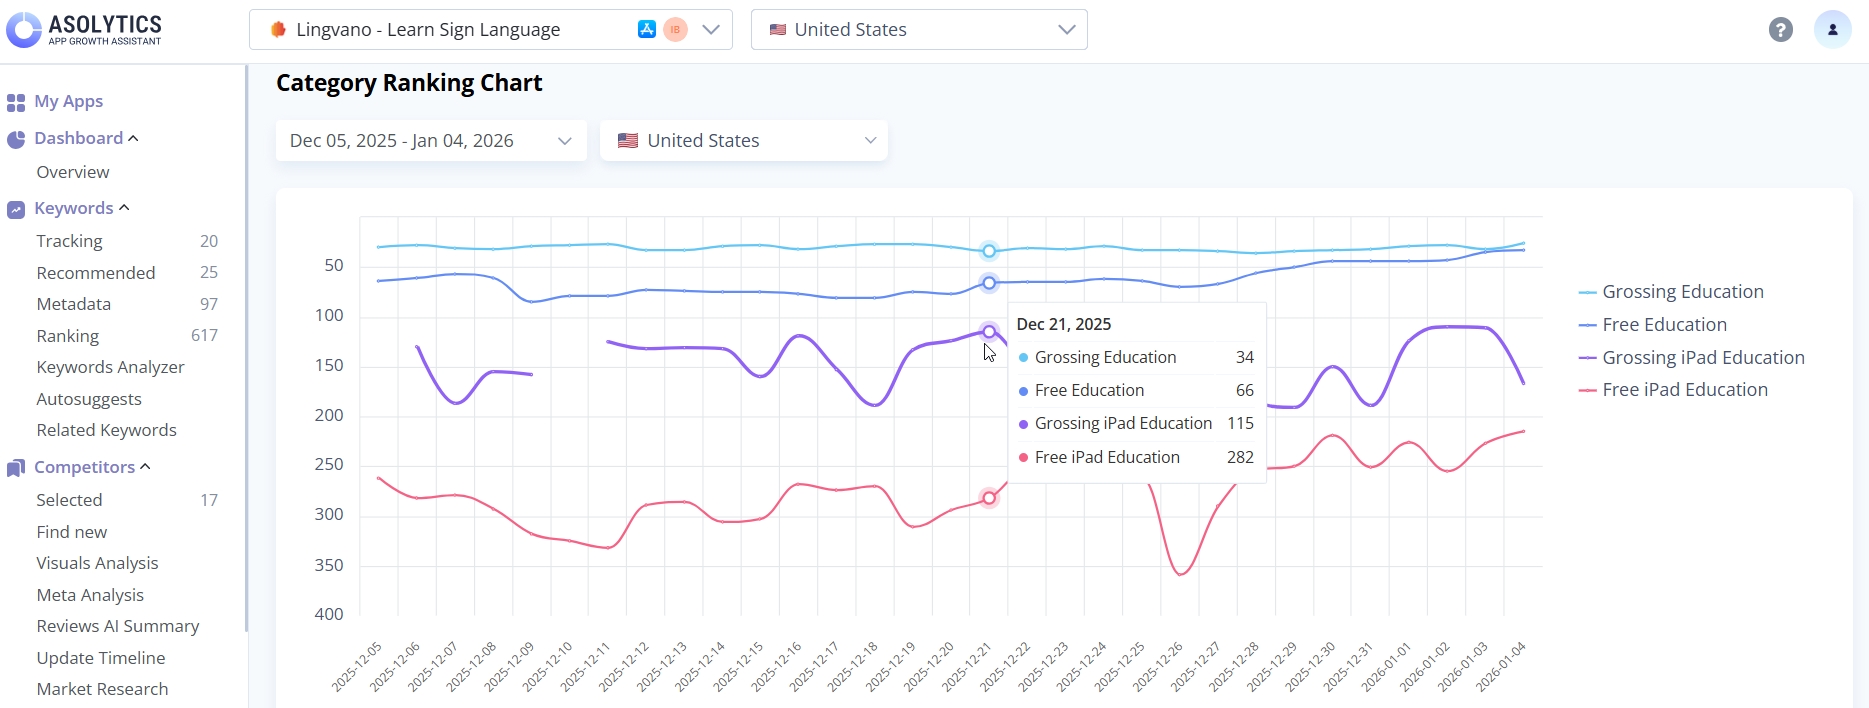
Category Ranking Chart
This chart shows how your app's category rankings change over time in the selected country. Each colored line represents a different category and device combination.
Note: Device-level rankings are available for App Store apps only.
You can adjust the date range and country using the selectors above the chart. It'll help you analyze different markets or time periods. Hover over any point on the lines to see the exact ranking for a specific category and device on that date.
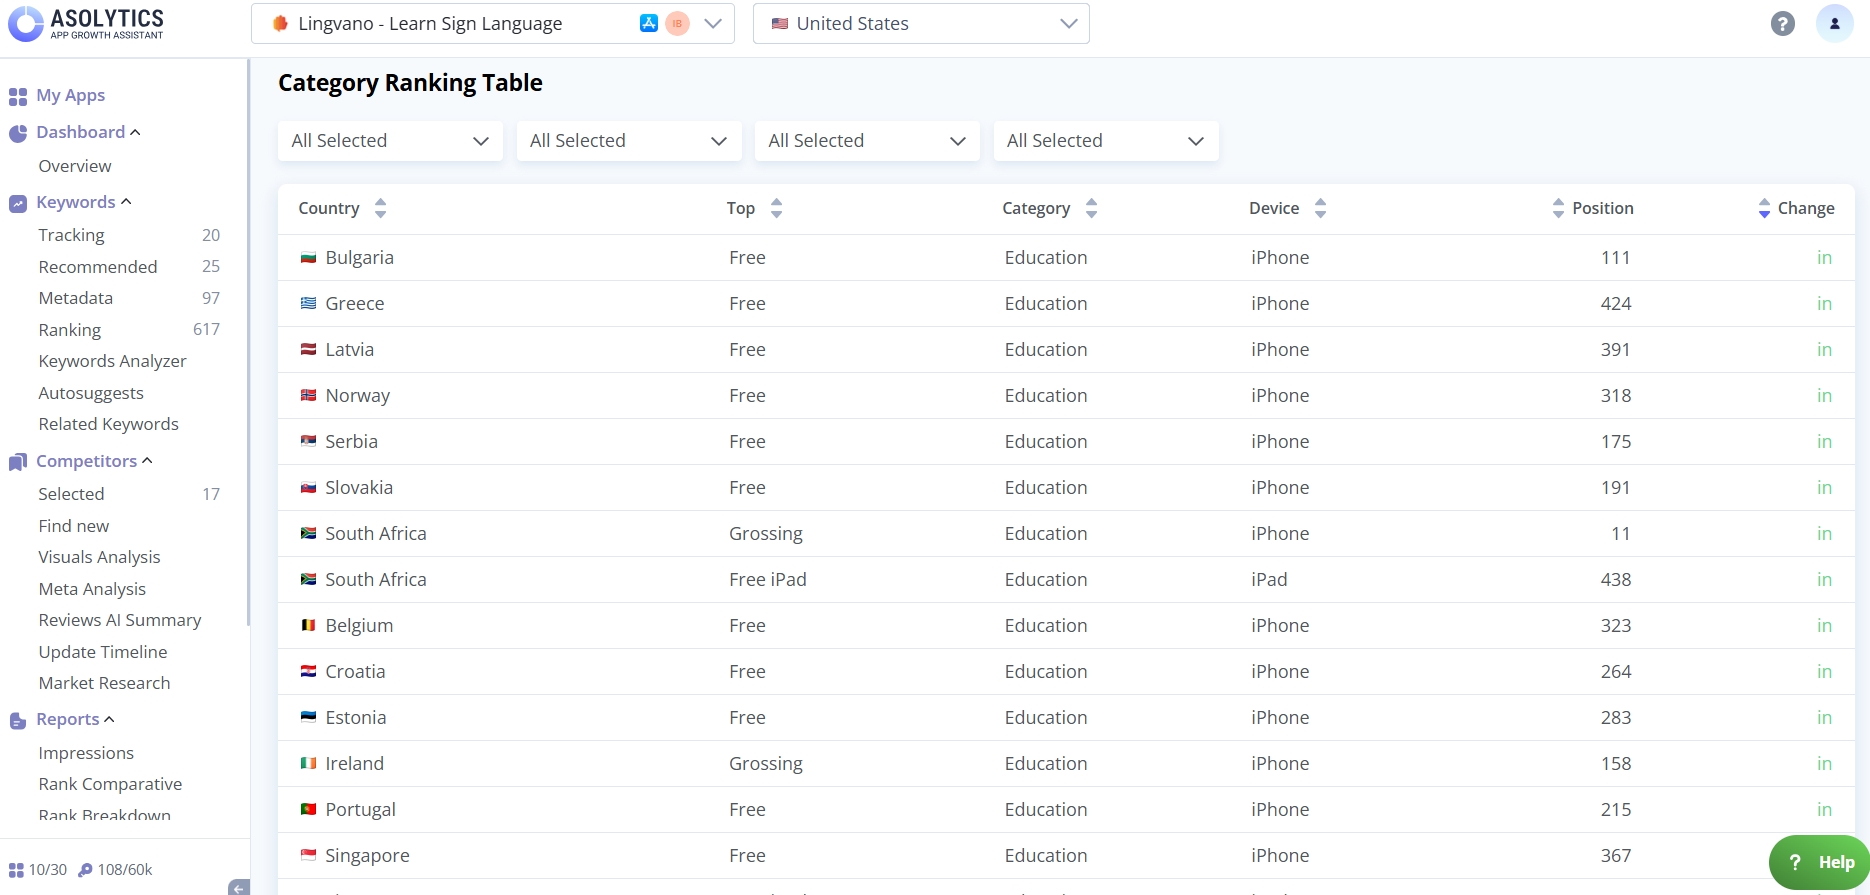
Category Ranking Table
The table below the chart provides a detailed, country-by-country breakdown of your app's rankings. You can filter by country, category, top chart type, and device.
Each row of the table displays:
- Country
- Top Chart (Free, Paid, Grossing)
- Category (e.g., Overall, Entertainment, etc.)
- Device
- The app's current position
- Change (how many positions the app moved up or down since the previous period)
This table helps you pinpoint where your app is gaining traction, where it's declining, and which markets contribute the most to category performance.
App Analyzer gives you a full view of any app's performance. Use these data to spot trends and optimize your app store strategy. With just a few clicks, you can make smarter decisions for app growth.