
Live Search
The Live Search tool displays how apps rank for any keyword or phrase in a selected country. With its help, you can understand what users actually see when typing a specific query. It also enables you to assess app competitiveness and identify the best apps to extract keywords from for your semantic core.
Why to use: Obtain up-to-date insights on apps associated with specific keywords in a chosen country.
Goal: Analyze competitors and keywords in depth, and gather high-performing keywords.
Time: Up to 5 minutes.
1. Type a Keyword in the Search Bar
To get started, select your app and target market from the dropdown menus in the header. For App Store apps, you can also select the device type – iPhone or iPad. (Note: This option isn’t available for Google Play.)
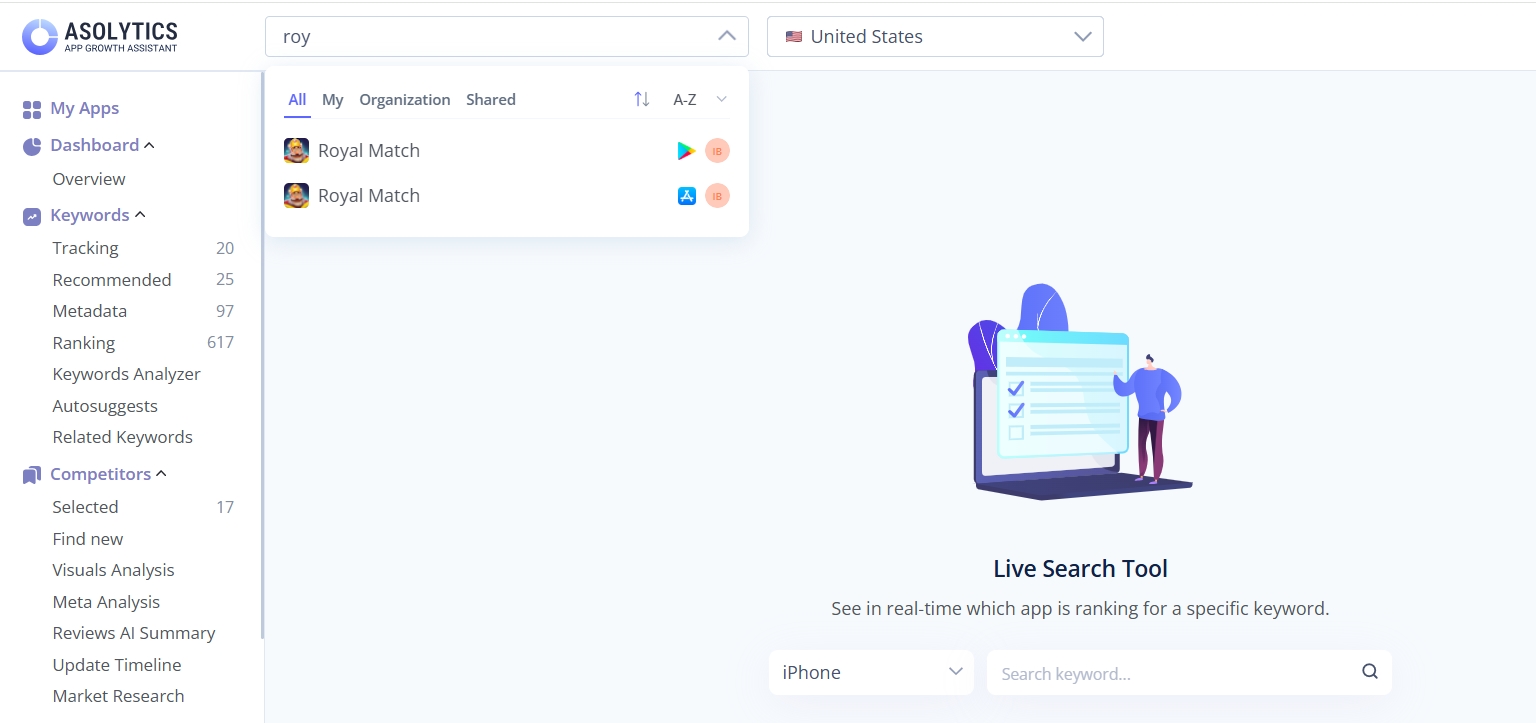
Within seconds, the tool will display top-ranking data. You can then compare key KPIs across the leading apps for that keyword.
2. Examine the Keyword Metrics
At the top of the page, you'll see 5 key metrics to help you evaluate your chosen keyword:
- Total apps: The total number of apps currently indexed in the store for this keyword.
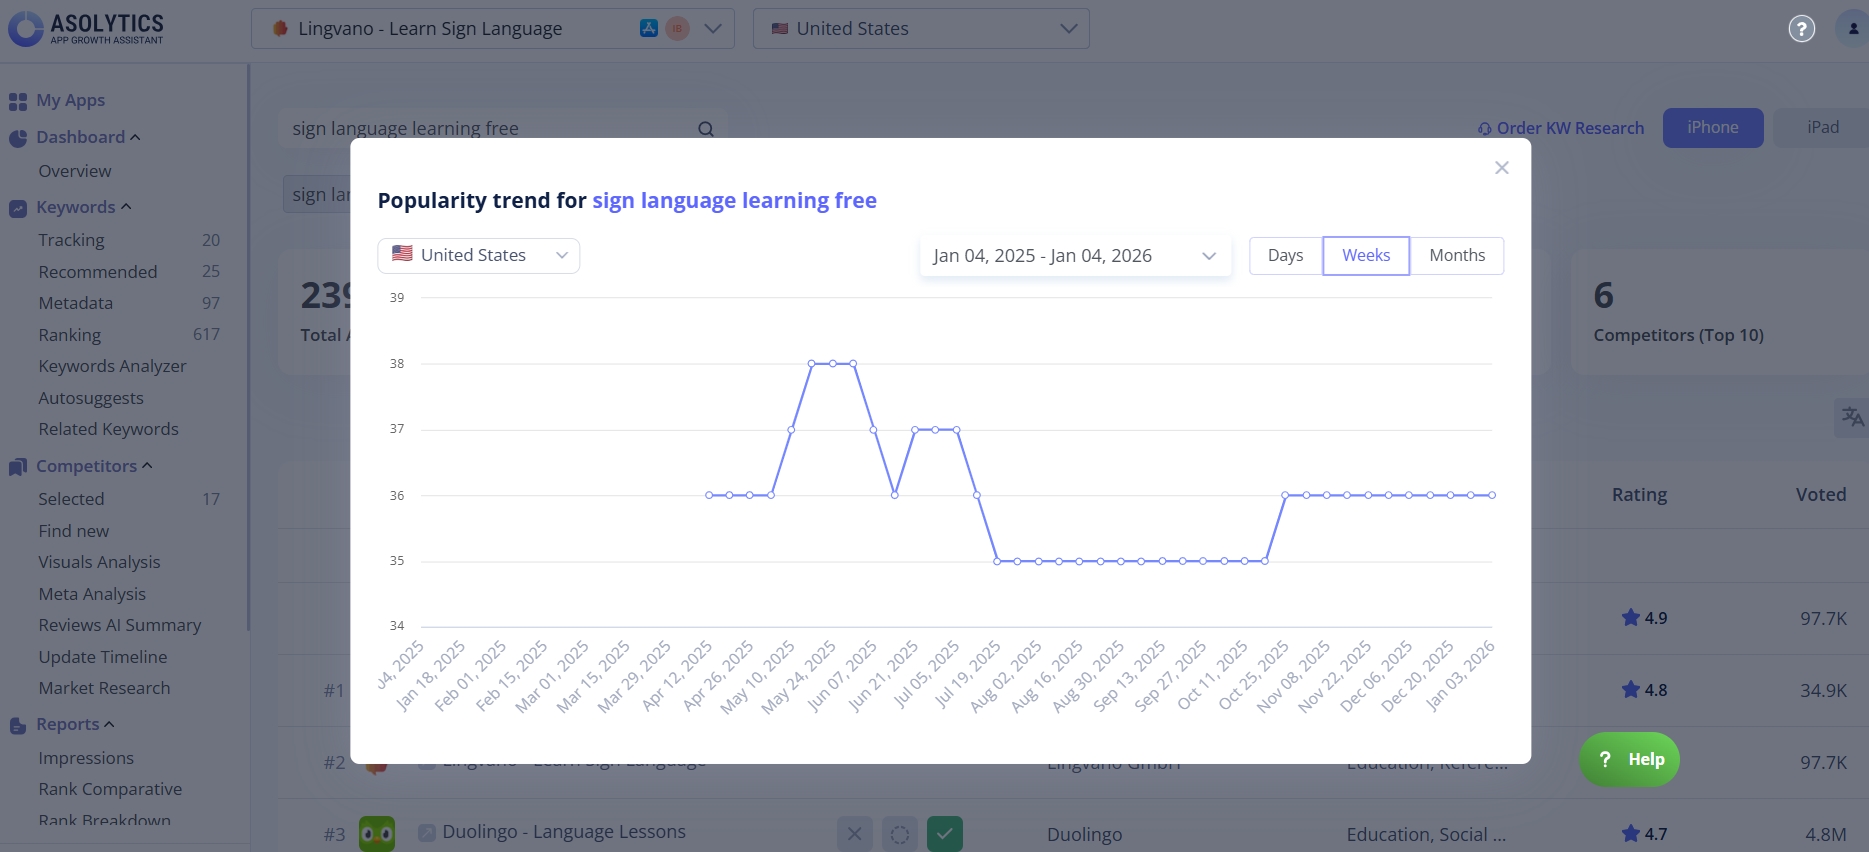
- Popularity: Shows how often users search for this keyword. To track changes over time, click the small chart next to "Popularity." In the pop-up window, you can adjust the dates and country to see trends in the term popularity.
- Daily impressions: The estimated number of times users search for this keyword per day in a specific country.
- Your app ranking: Your app's current position in search results for this specific term.
- Competitors (Top 10): Shows how many of your top 10 competitors appear for this keyword in the app store.
Below the search bar, the Live Search tool displays additional keywords related to your search term. These suggestions show alternative ways users might look up your product. Click any suggested keyword to view its detailed metrics.
To explore more keyword suggestions, click More Suggests to access the full version of the Keyword Autosuggest tool.
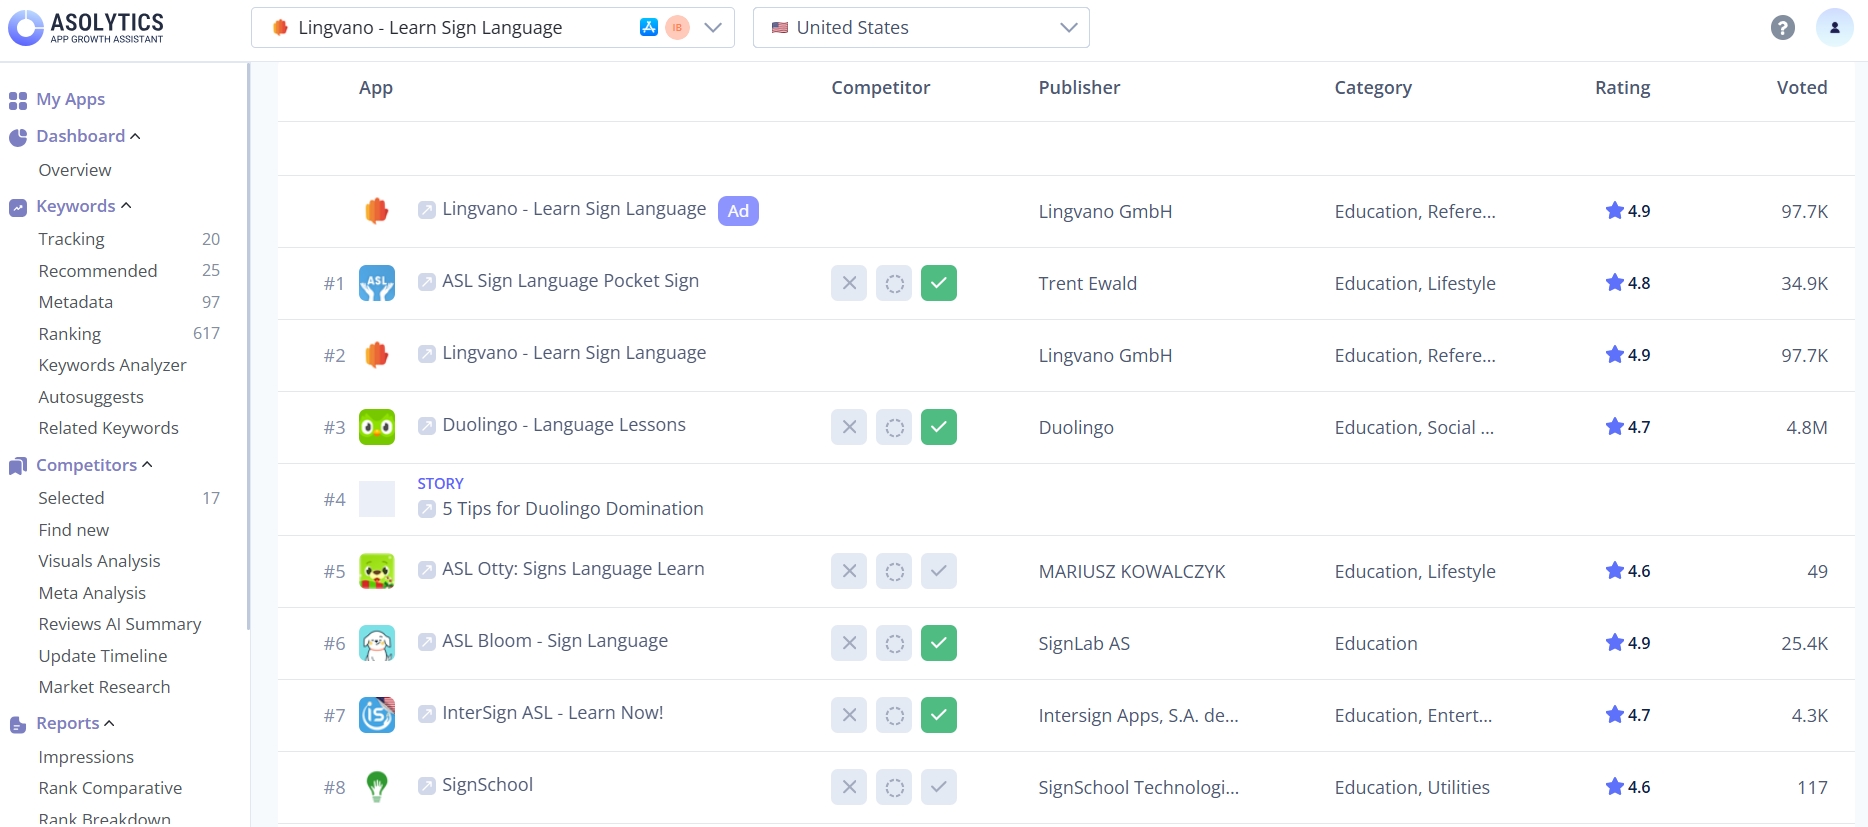
3. Study the Competitors Table
Next, scroll down to the table that lists competing apps for your selected keyword. The table contains 6 columns:
- App. Here, you'll find the app's name and logo. Click either to open a pop-up window with the detailed information about the product.
- Competitor. This column indicates whether an app is marked as a direct competitor, an indirect competitor, or a non-competitor. You can change this classification at any time.
- Publisher. Check here the company or developer behind the app.
- Category. In this part, you can see which category the app belongs to. Typically, highly specialized searches will show you products from a single category, while more general keywords can appear in various niches.
- Rating. Here, you'll see the average star rating for the app in its respective store.
Voted. The last metric shows the total number of users who have rated a product.
By default, the table displays the top 10 apps. To explore more competitors and get a broader view of the market, click Load More below the table.
4. Get More Insights
Scroll down to find two more sections that give you a clearer picture of what your competitors are up to.
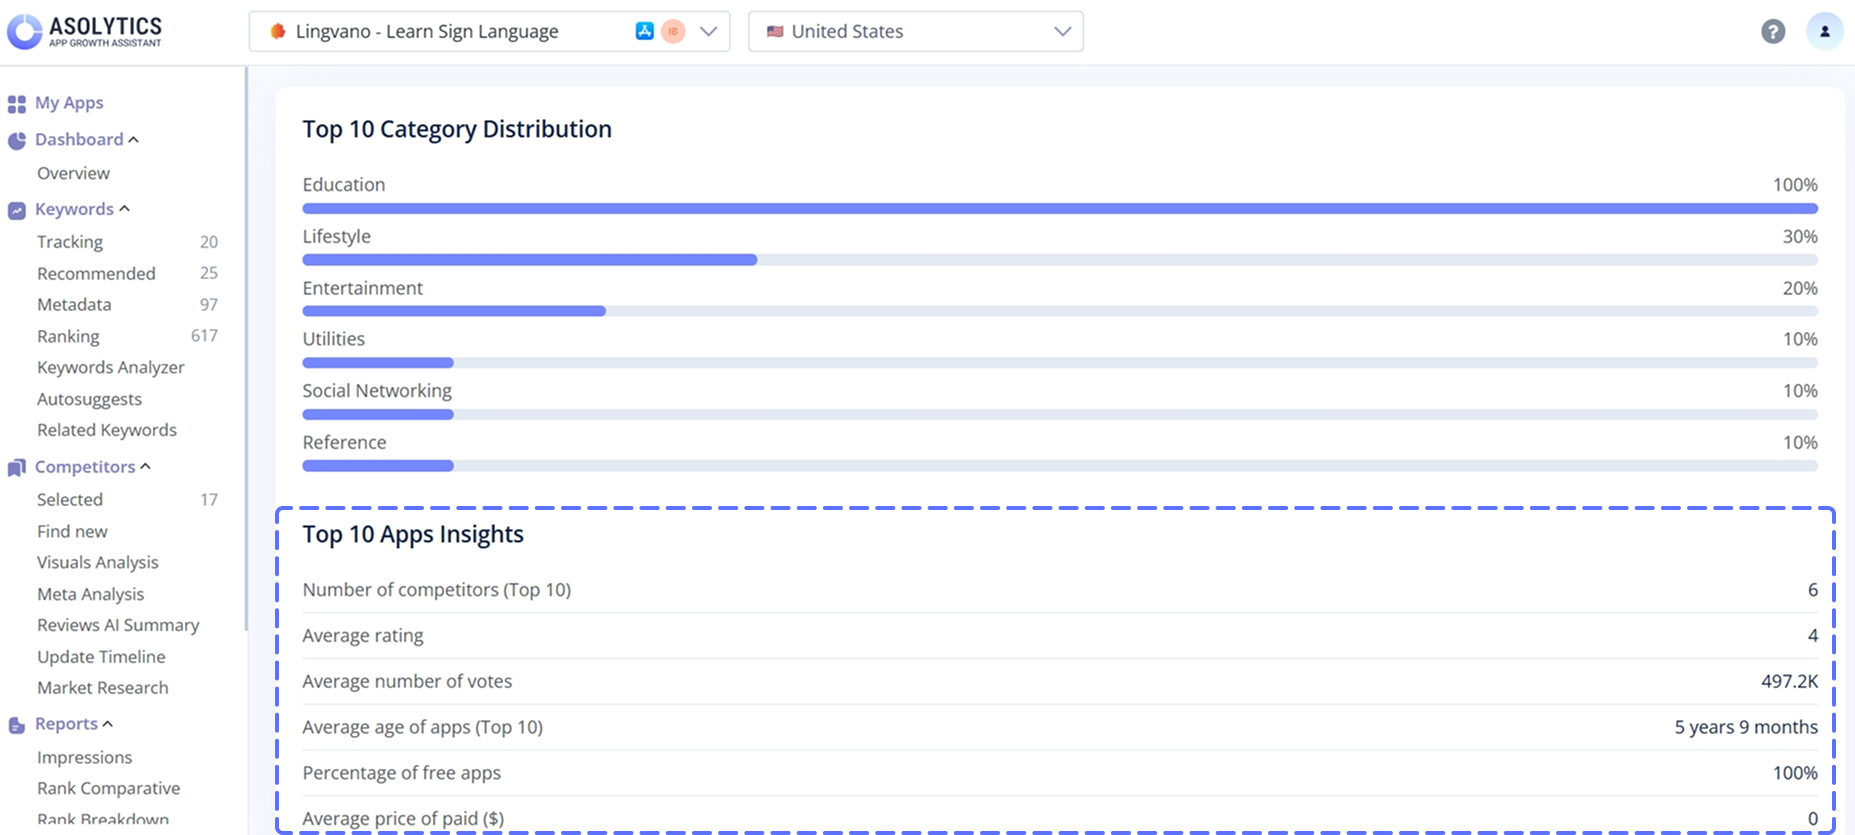
Top 10 Category Distribution
This chart shows categories dominate the top 10 results. These percentages show the diversity of your competition and help you understand the market for your keyword.
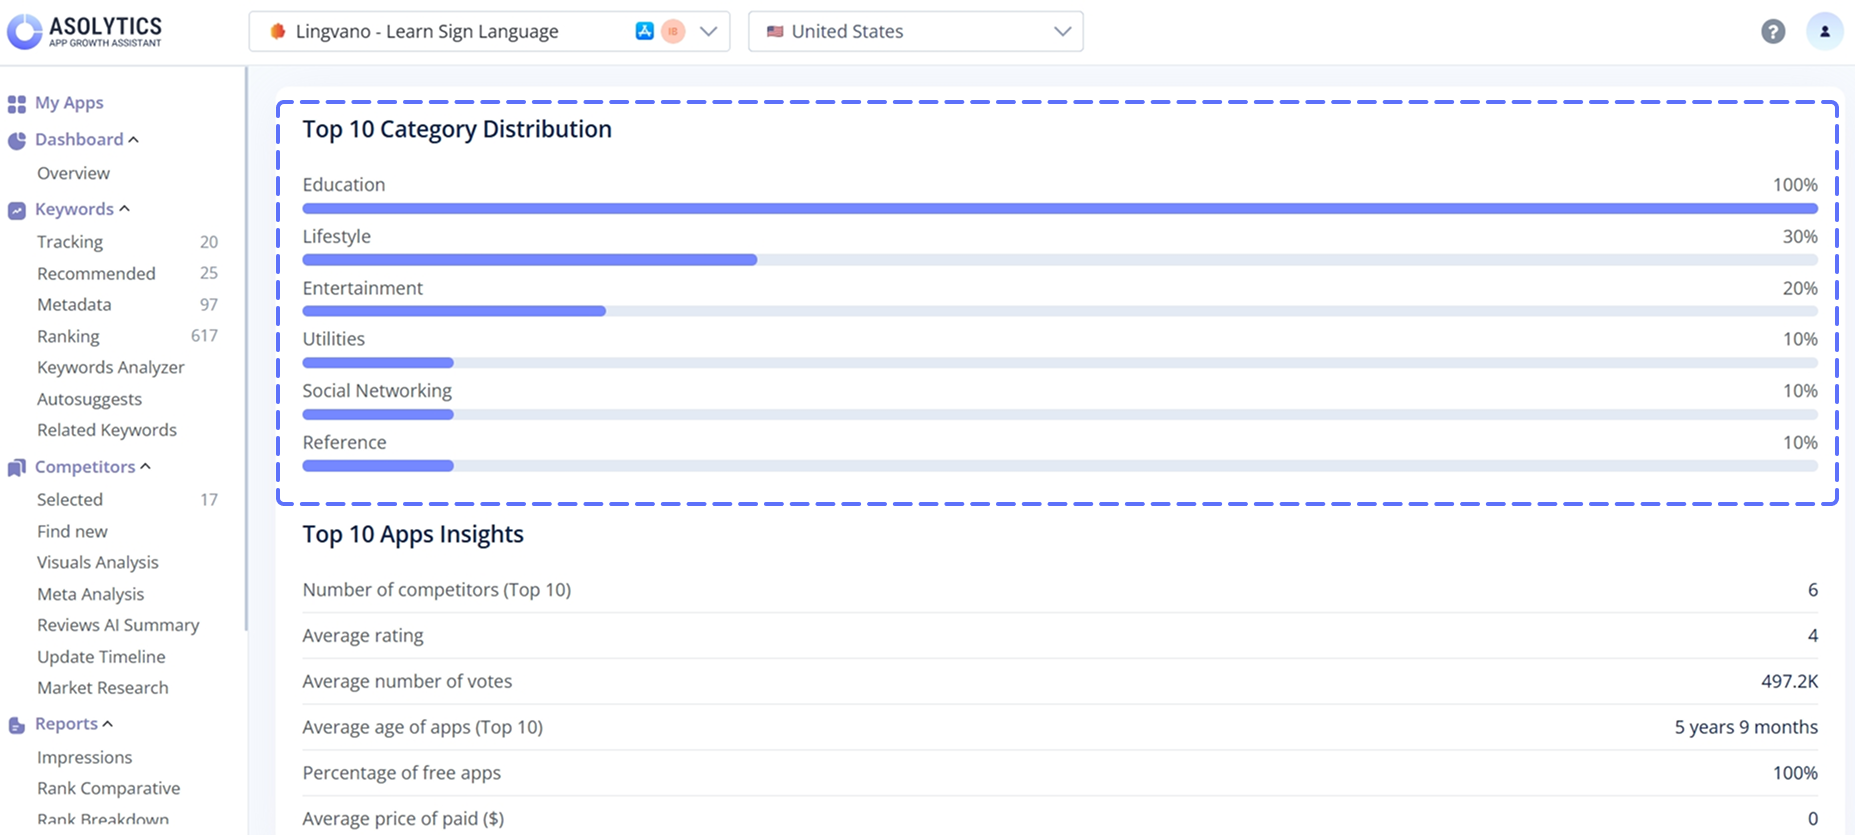
Top 10 Apps Insights
In this section, you can examine the average metrics calculated from the top 10 ranked apps for your keyword:
- The number of competitors shows the total number of apps you've marked as direct competitors that appear in the search results for this keyword.
- Average rating reflects the average user rating of the top 10 apps in the corresponding app store.
- The average number of votes displays the mean number of users who have rated the Top 10 apps.
- The average age of apps (Top 10) indicates the average time these apps have been available in the store.
- The percentage of free apps shows the share of free apps among those ranked for the keyword.
- The average price of paid apps highlights the mean price of apps in dollars.
Data is based on users’ requests in real-time. Therefore, Live Search results change over time, so you can get up-to-date analytics whenever you use the tool.
Note: All data is based on real-time user searches. Because of this, Live Search results update continuously and give you access to fresh and up-to-date analytics each time you use the tool.