
Store Charts
The Store Charts tool gives a list of the top apps across different categories with their main performance metrics.
Why to use: Examine the top apps and identify market trends and optimization patterns that can improve your app’s performance.
Goal: Analyze top-performing apps and benchmark their ASO, engagement, and monetization strategies.
Time: Up to 5 minutes.
1. Choose a Country and App Store
By default, the Store Chart tool displays data for the app store and country selected in your app analysis settings. To view data for a different country or app store, simply use the dropdown menus in the page header.
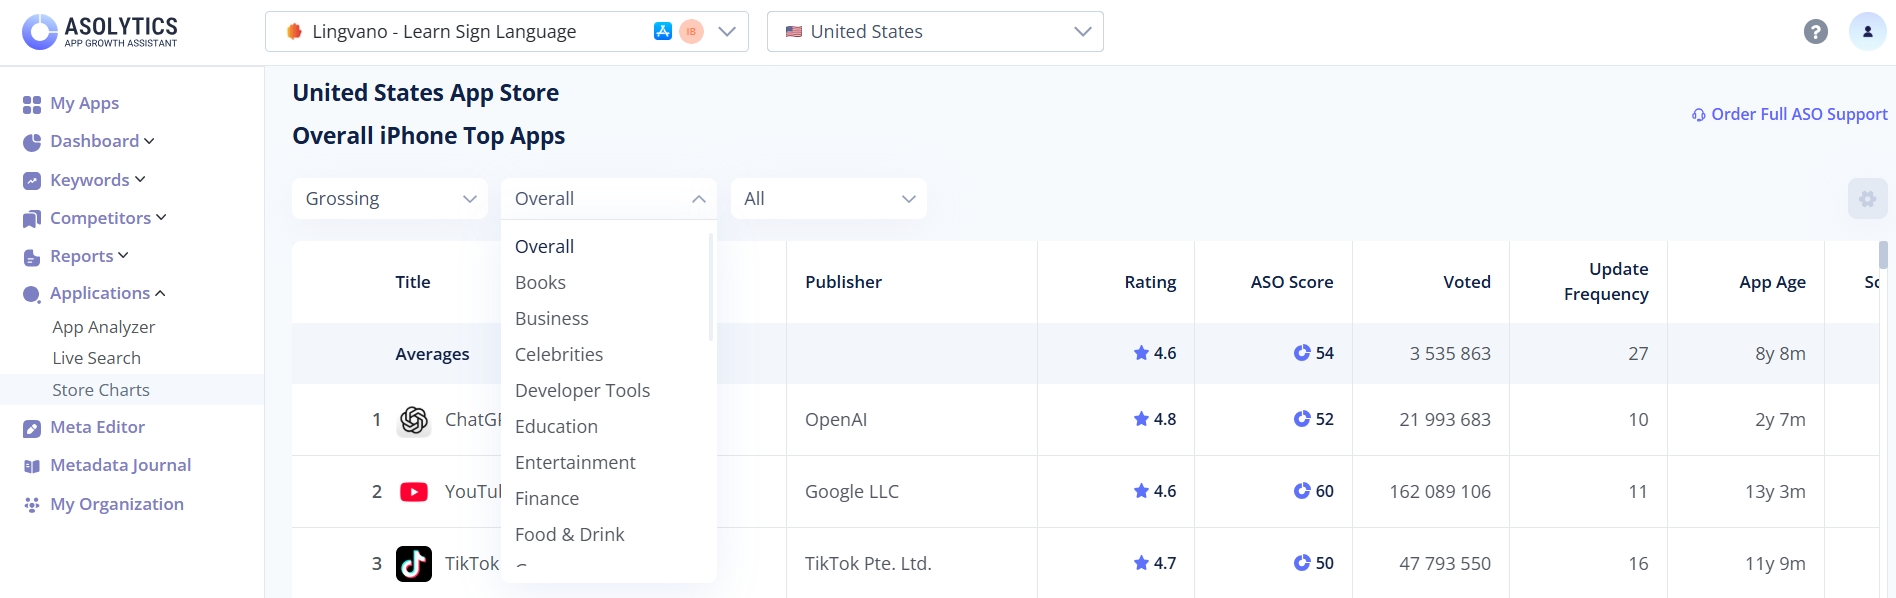
2. Customize the Settings
Now you can choose the categories you want to study. You can sort the top apps by the following options:
- Free, Paid, and Grossing (with the highest total revenue)
- Specific app stores' categories (or all of them)
- With or without in-app purchases (or all apps)
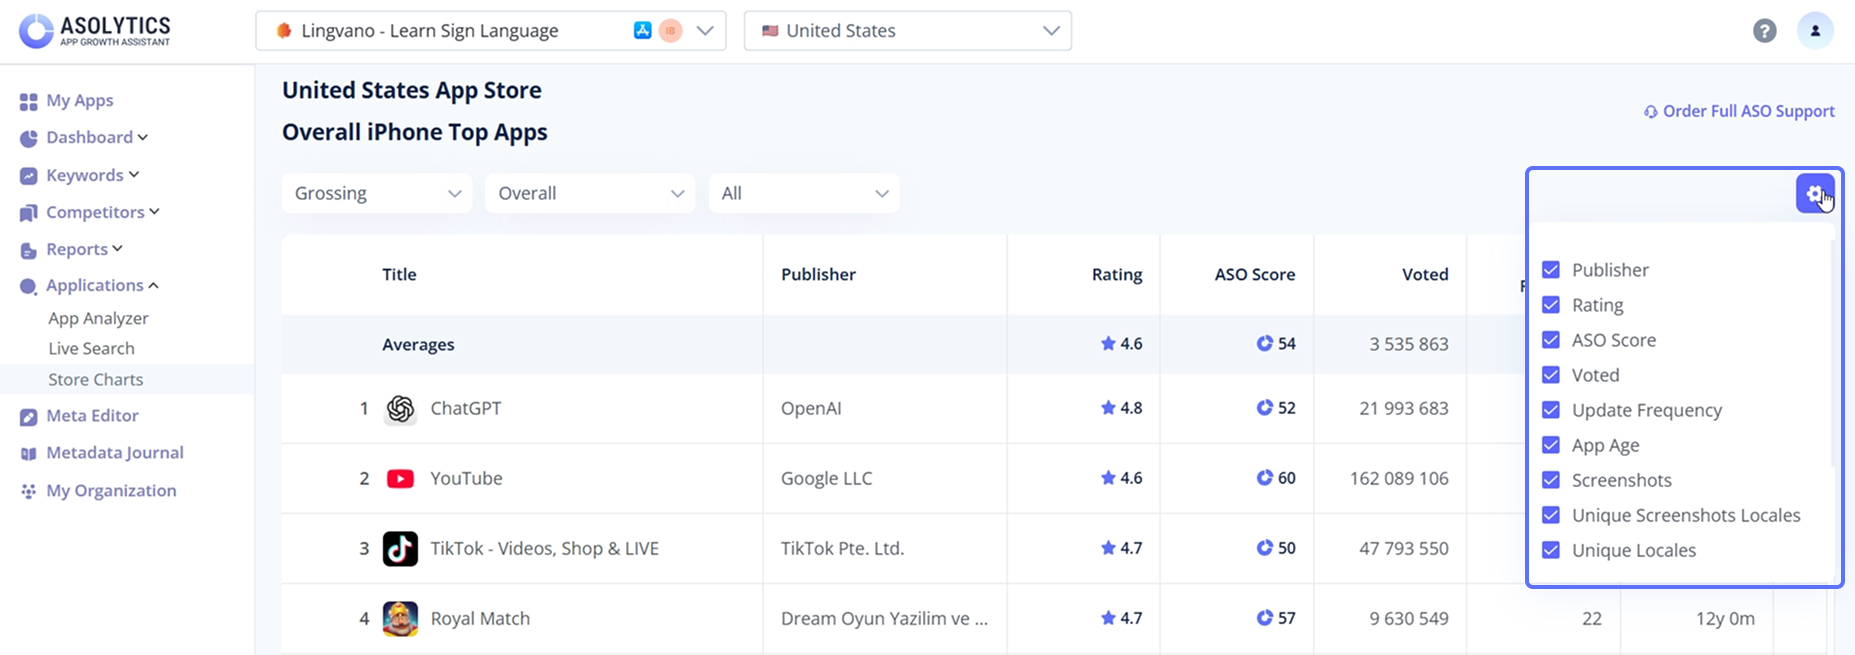
You can also customize which data displays in the table. For this purpose, click the gear icon in the top right and select your preferred options from the drop-down list.
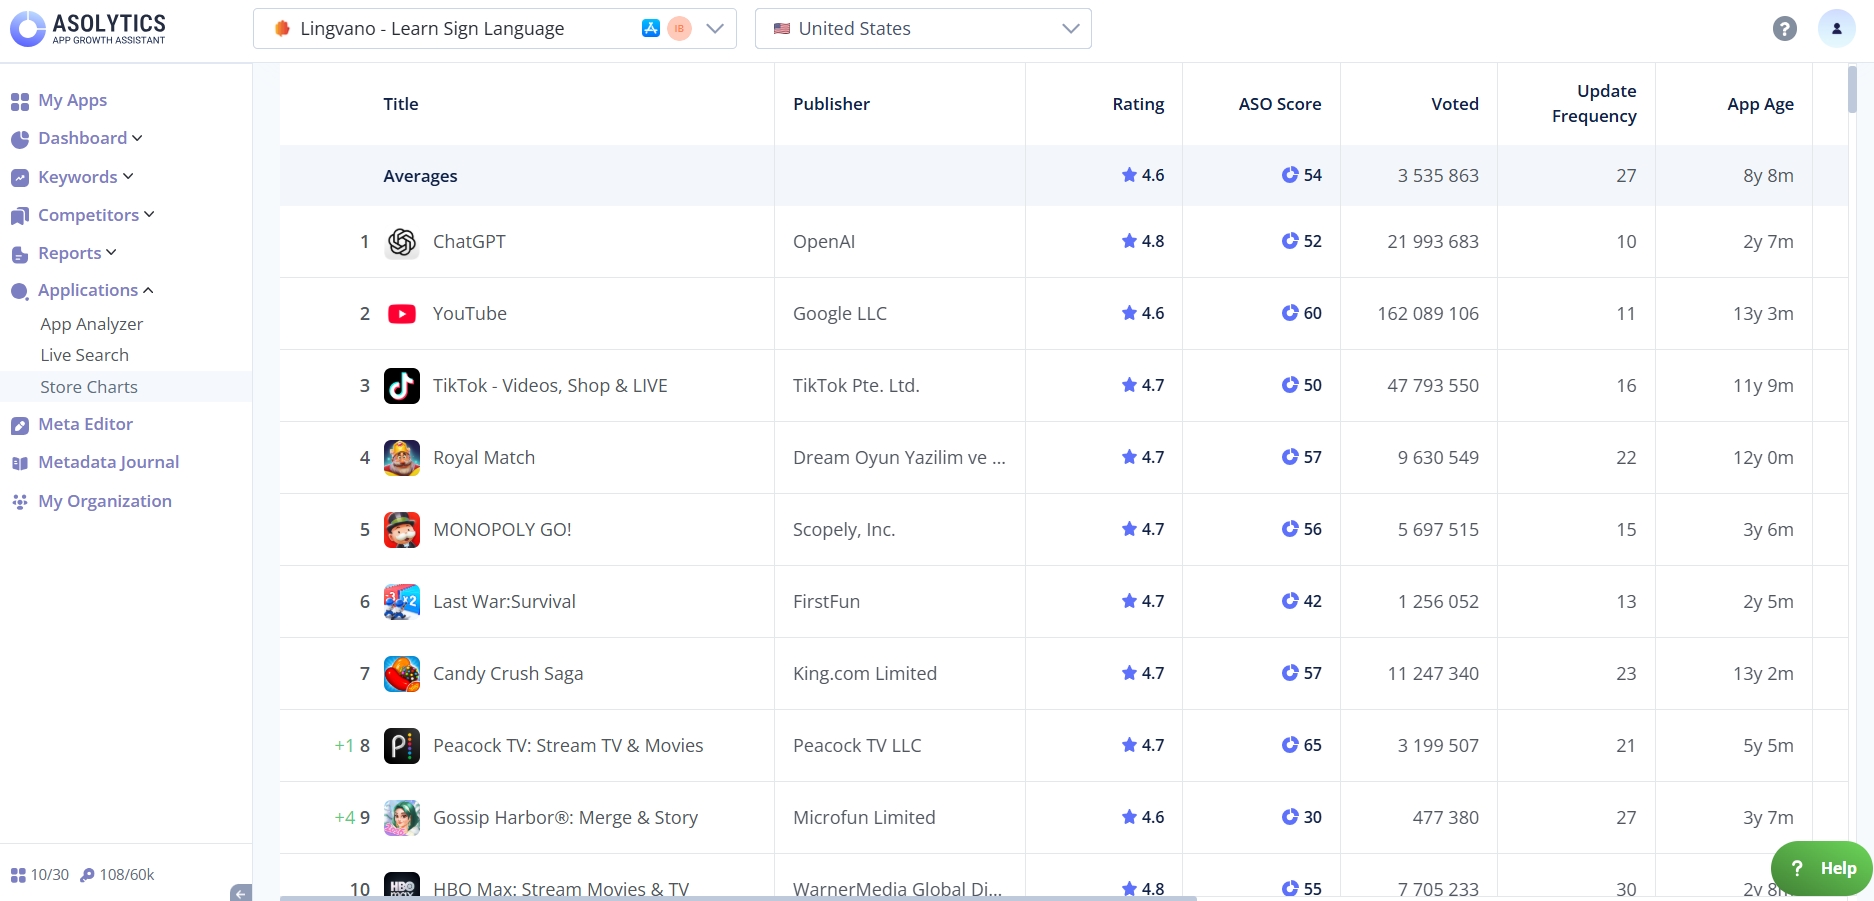
3. Study the Metrics
The first row of the table shows the averages for your selected categories. Compare these to your app's metrics to identify gaps and opportunities.
Then review the metrics for each top app individually. Pay attention to position changes: green indicates the app has moved up in rankings, while red indicates it has dropped.
Here are the metrics you'll see in the table:
- Title. This column displays the app's name and icon. Click either one to open a detailed pop-up with more information about the app.
- Publisher. It shows the company that owns the app and helps you identify major publishers or studios dominating the chart.
- Rating. Here, you'll find the app's average user rating in the store.
- ASO score. It's a composite metric reflecting how well an app is optimized for the store (metadata, visuals, localization, etc.)
- Voted. This metric displays the total number of user ratings the app has received. High vote counts usually signal strong download volume over time.
- Update frequency. Frequent updates often mean better store visibility, improved rankings, and stronger user trust.
- App age. In this column, you can see how long the app has been available in the store. It helps you distinguish between long-standing market leaders and rapidly growing newcomers.
- Screenshots. This part highlights the total number of screenshots used on the app's store page.
- Unique screenshots locales. Here, you may view the number of locales with custom screenshots to understand how deeply the app is localized visually.
- Unique locales. It indicates how many languages or regions the app supports and allows you to quickly assess its international reach.
- Last update. Check here the date of the most recent app update.
IAP price from / IAP price to. These columns display the minimum and maximum in-app purchase prices. With this information, you can better understand monetization strategies and pricing ranges used by top-grossing apps.
Pro tip: Return to the Store Charts tool regularly to track changes in app trends. If you've localized your app for multiple regions, analyze charts from different countries to gather more comprehensive competitive insights.