
Tracking
The Tracking tool stores your app's semantic core. Here, you can see how the collected keywords perform in real time in a specific app store.
Why to use: Collection of effective semantics for the app listing.
Goal: Track the performance of specific keywords to identify those that most effectively boost app visibility.
Time: Up to 1 minute to compare 3 keywords added manually one by one.
Tracking helps you understand which keywords actually drive visibility and downloads. By monitoring performance trends, you can focus on the most effective search terms and continuously refine your app's metadata strategy based on real data.
Below, you'll find step-by-step instructions for using the tool effectively.
1. Add Keywords
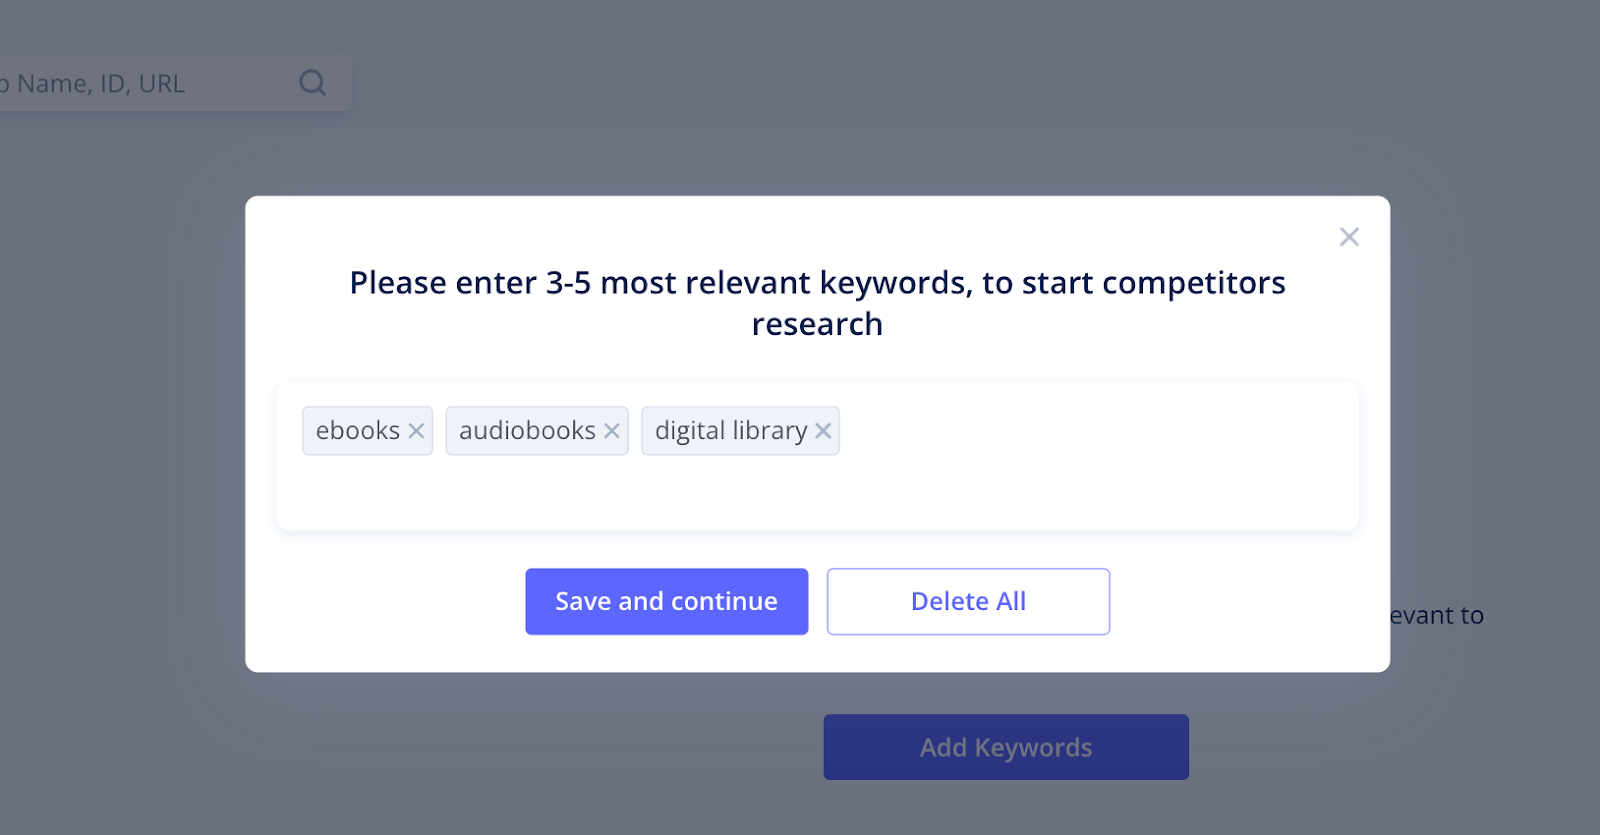
To start working with the tool, click Add Keywords. Type or paste your keywords into the pop-up window that appears. If you're adding multiple keywords, separate them with commas.
Note: You can analyze one keyword or several at once.
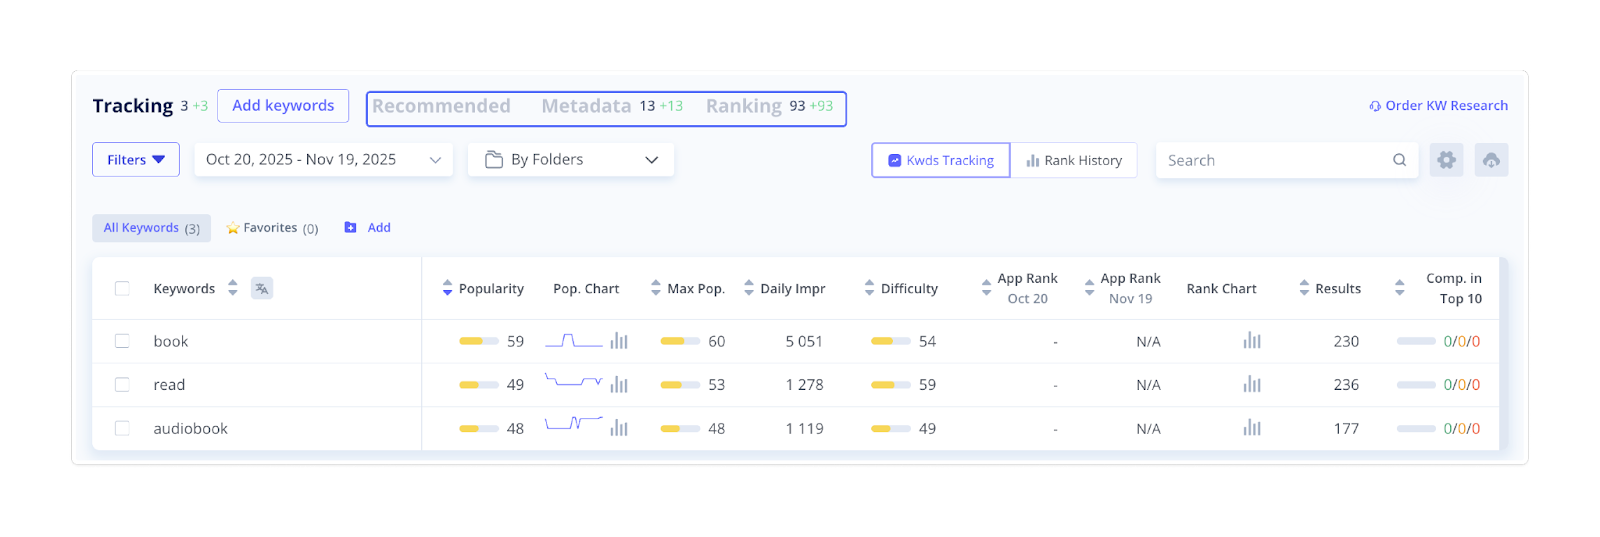
You'll see the total number of tracked keywords next to the Tracking tab. Newly added terms are highlighted in green.
You can quickly switch to other keyword tools from the top toolbar to find more terms for your tracking list:
- Recommended. This tab contains relevant keywords in different languages collected by Asolytics algorithms from your app's metadata, competitors' text assets, and suggestions. The list is updated regularly, so check back from time to time for new insights.
- Metadata. Here, you'll find popular keywords and phrases from the selected app's metadata. After you choose competitors using competitors' tools, you'll get keywords from their metadata here.
- Ranking. This tab displays the list of all the keywords from the related apps, along with their total count and any new additions during the selected tracking period.
Necessary action: To get a complete list of relevant keywords, select your direct competitors under Competitors → Find New. After you add as many competitors as possible, the algorithms will provide you with all the related keywords tracked in real-time across app stores.
2. Filter the Results
After adding keywords, you can narrow your analysis using filters to focus on specific metrics or keyword groups.
You can filter by:
- Popularity
- App Rank
- Competition in Top 10
- Language
- Folders
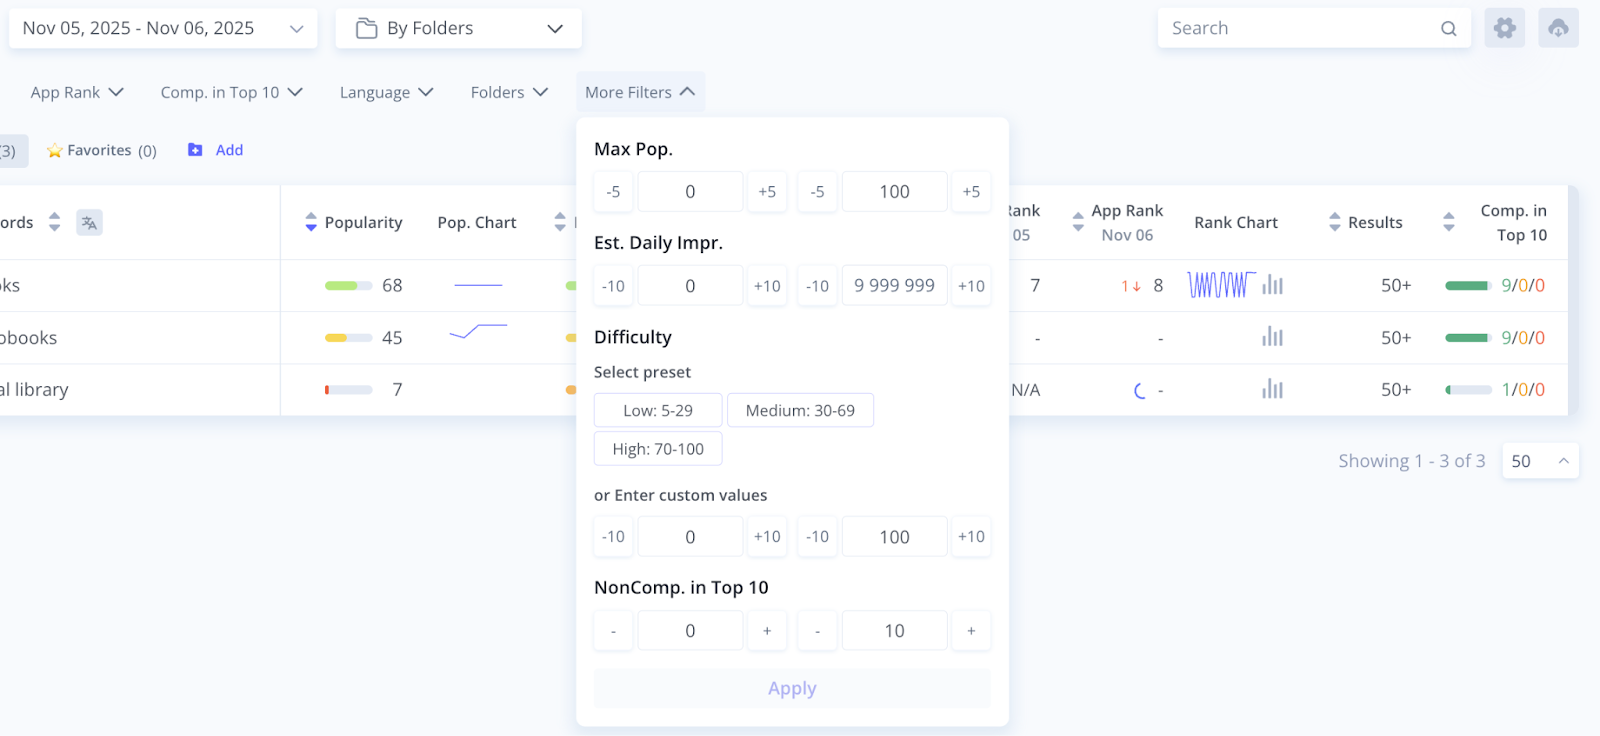
Click More Filters to access additional parameters, such as:
- Max Popularity
- Estimated Daily Impressions
- Difficulty
- Non-Competitors in Top 10
Filtering helps you quickly identify the most valuable keywords. Instead of reviewing hundreds of terms at once, you can focus on those that have the highest search potential or best performance for your target market.
3. Set Date Ranges and Refine the View
After applying filters, select the date range to compare keyword performance over specific periods.
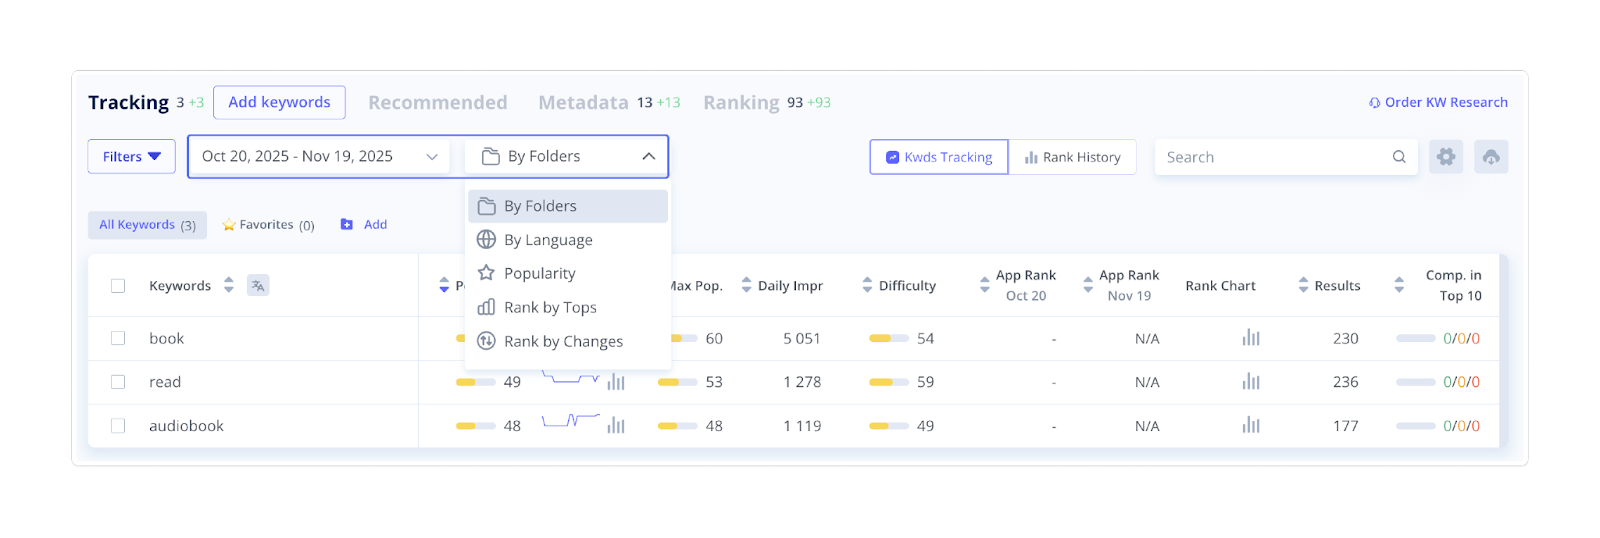
To the right of the date selector, you'll find a dropdown menu to refine your keyword list even further. Each option changes the set of buttons displayed above the table, giving you more control over how you view your data:
- By Folders. Displays all folders you've created and the number of keywords in each. You can also click Add to create new folders for better organization.
- By Language. Groups your tracked keywords by language – perfect for multilingual apps.
- Popularity. Shows preset popularity levels and the number of keywords that fall under each.
- Rank by Tops. Displays keyword rankings by position ranges and allows you to focus on keywords where your app currently ranks within specific tiers.
- Rank by Changes. Highlights keywords where your app’s ranking has recently increased or decreased.
Adjusting date ranges and sorting options helps you monitor ranking progress and focus on areas where your app gained or lost visibility.
4. Analyze Keyword Metrics
Once your keywords are added and filtered, it's time to analyze their performance. Each tracked keyword appears in the table with live, detailed metrics that help you assess its effectiveness.
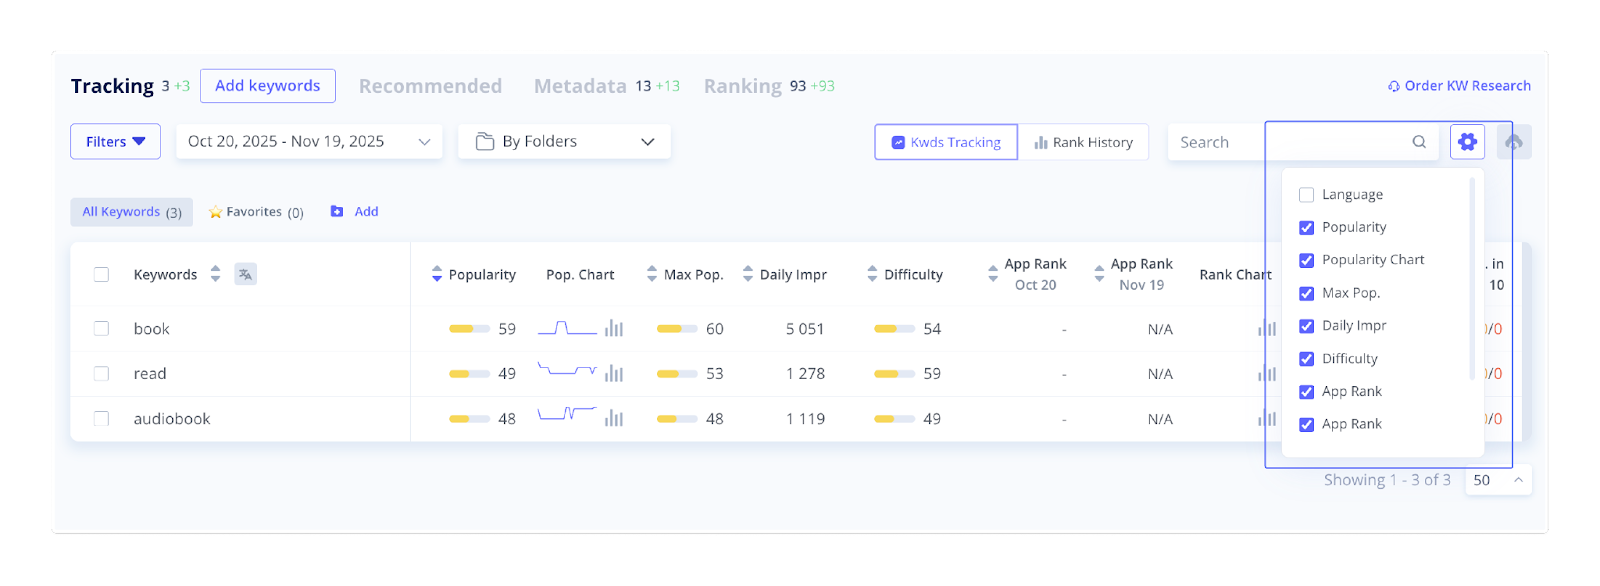
You can customize your table by clicking the Settings (gear) icon to add or remove metric columns. You can also translate keywords into English directly in the interface for easier review.
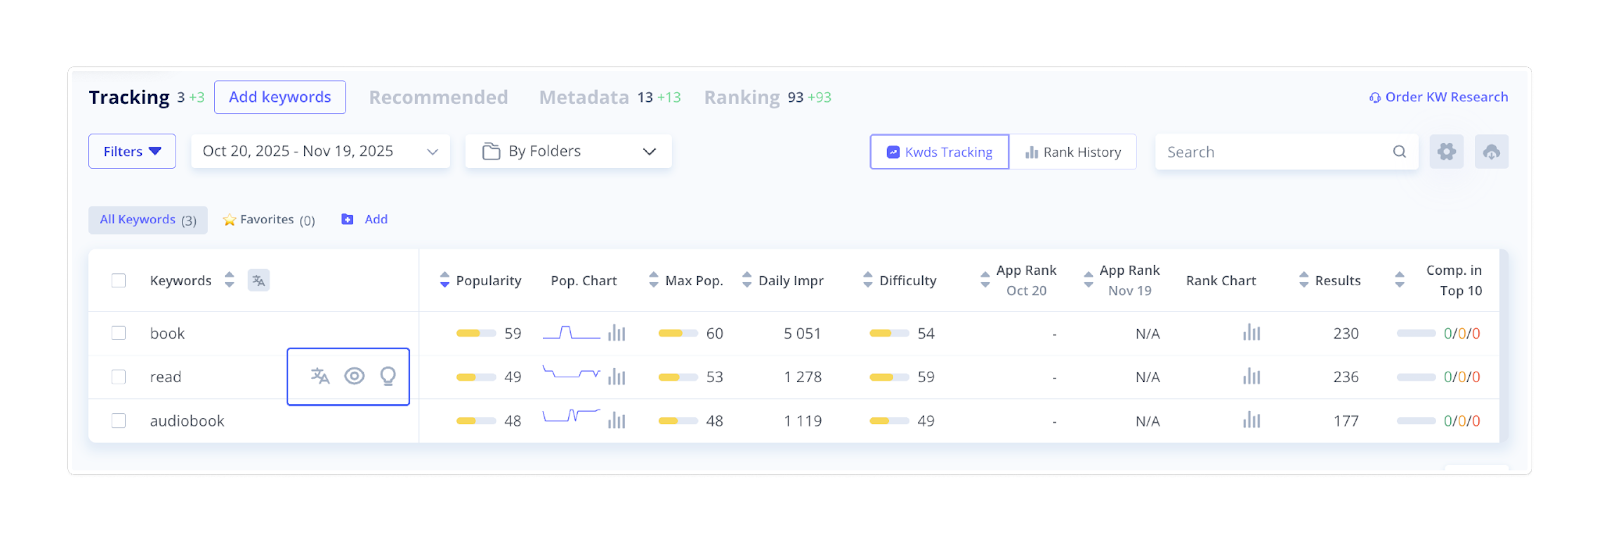
When you hover your cursor over a keyword, several quick-action options appear:
- Translate – instantly translates the selected keyword into English.
- Live Search – shows the competitors' apps rated by that keyword.
- Autosuggest – displays a short list of related keyword suggestions based on the selected term.
Now, let's dive deeper into the metrics you'll see in your table.
Popularity
The Popularity metric helps you understand how frequently users search for a particular keyword in app stores. It includes 3 columns:
- Popularity shows the estimated search frequency for the keyword. The value ranges from 5 to 100, where 5 indicates minimal popularity and 100 represents the highest possible interest.
- Popularity Chart provides a visual overview of the keyword's trend over time. Click Open Chart to see the dynamics of the keyword popularity in the chosen country and through the chosen time period.
- Max Popularity displays the highest recorded popularity score for the keyword, helping you identify its peak demand.
This metric gives you a quick sense of which keywords are most searched by users and how their popularity evolves over time.
Daily Impressions
The Estimated Keyword Daily Impressions metric shows how many times a keyword is searched for per day within a selected country. It reflects search volume potential, not actual traffic to your app.
Note: This metric estimates keyword visibility. It does not represent the number of impressions your specific app will receive based on its ranking.
Difficulty
The Difficulty metric indicates the potential ease of ranking for specific keywords. High difficulty suggests strong competition, as multiple well-established apps are already ranking for that keyword. Low difficulty keywords offer more accessible opportunities to improve visibility and reach.
Use this metric to balance your keyword strategy between competitive and easier-to-rank terms.
App Rank
The App Rank metric includes two columns: one showing your app's current position for a given keyword, and another displaying its position at the start of the selected tracking period. The higher the rank number, the more visible your app is in search results. For example, an app with the rank “1” stands higher in the search results, which means it’s more visible than an app ranked with “10”.
You can track ranking dynamics over different time ranges to spot trends and evaluate progress. The green or red number next to the rank indicates whether your app's position has moved up or down during the chosen period.
This metric helps you quickly assess how your app's visibility changes over time for each tracked keyword.
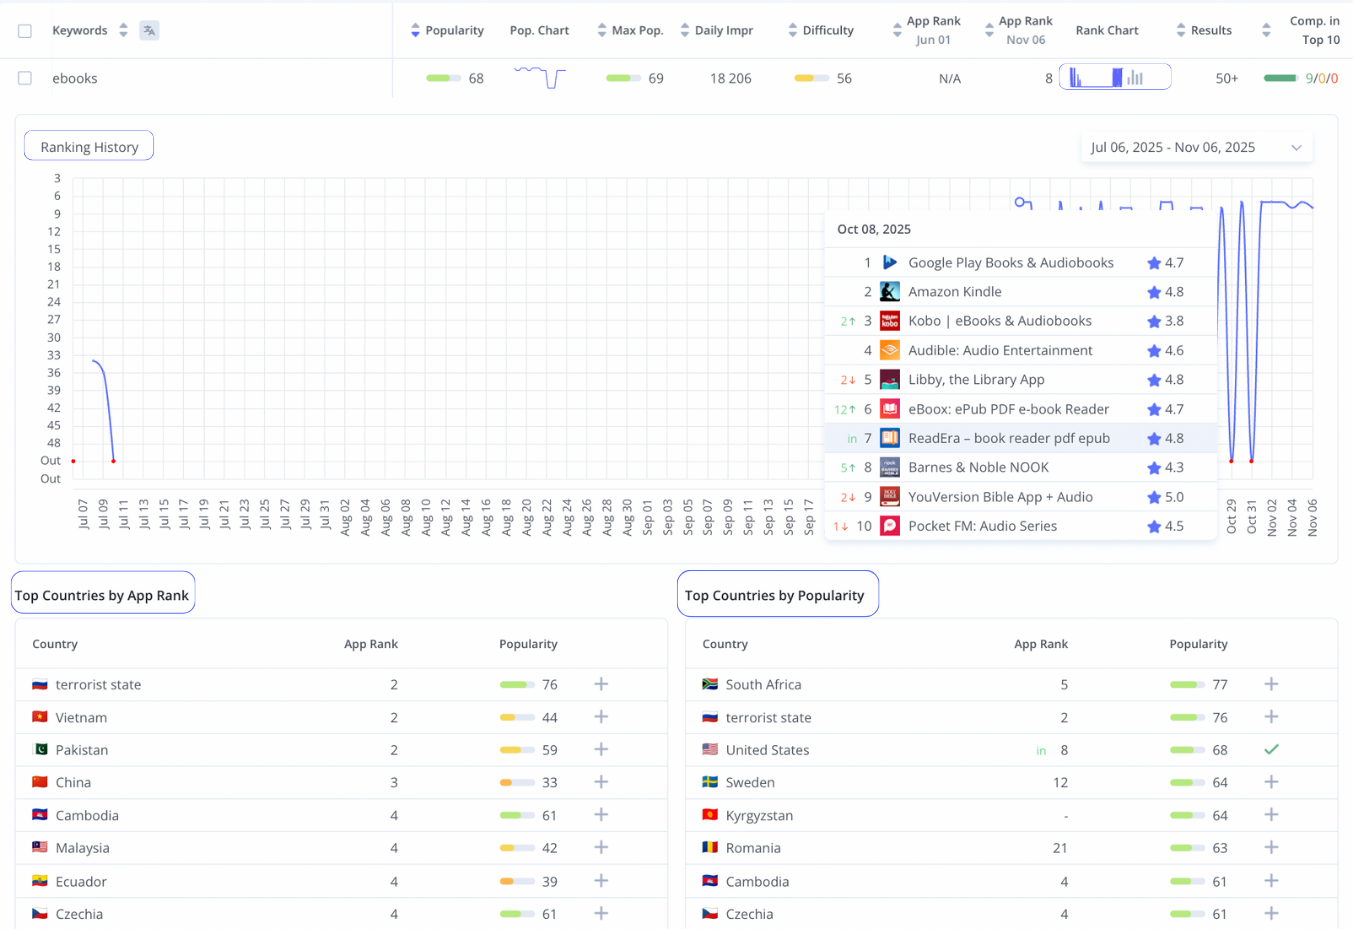
Rank Chart
The Rank Chart visualizes the daily dynamics in app rankings for a specific search term. Click Show More to see the detailed chart and list of the countries where the app is ranked or is popular by the chosen keyword.
Results
The Results metric shows how many apps appear in the app store search results for a given keyword. This number reflects the level of competition – the more results, the tougher it may be to stand out.
Competition in the Top 10 Apps
This bar chart shows how many of the top 10 apps ranked for a specific keyword are marked as your direct competitors, indirect competitors, or non-competitors.
Analyzing this metric helps you gauge competitive density and identify keywords where you can realistically reach or defend a top position.
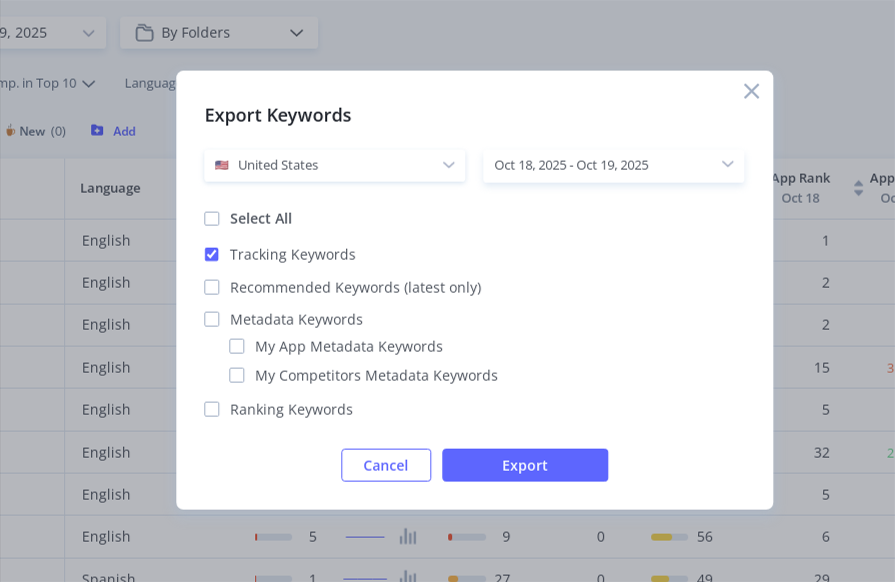
5. Download Your Results
Once you've filtered and analyzed your keyword data, you can download the results for further review or reporting. Click Download in the top-right corner of the page and select the data you want to export in the pop-up window.
Exporting your results helps you preserve historical data and share insights with your team.
The Tracking tool is your central workspace for monitoring how your app's keywords perform and evolve in real time. Use its features and metrics to make data-driven ASO decisions and refine your strategy for better visibility and growth.