
Dashboard
Dashboard is your starting point for ASO (App Store Optimization). It summarizes data about your app's optimization, reveals mistakes, gives immediate prompts, and shows key information from the main tools. At Dashboard, you can detect general imbalances (e.g., good visibility but poor conversion) and then move into the more specific tools (keyword tool, competitor analysis, etc.) to conduct a deeper study and find how to remediate the situation.
Why to use: Your app performance analysis.
Goal: Identification of the weaknesses in your app optimization. Key metrics analysis. Quick insights based on your app's competitors.
Time: Up to 10 minutes.
Dashboard includes 5 tabs with basic information about your app. Let's take a closer look at each.
1. Overview
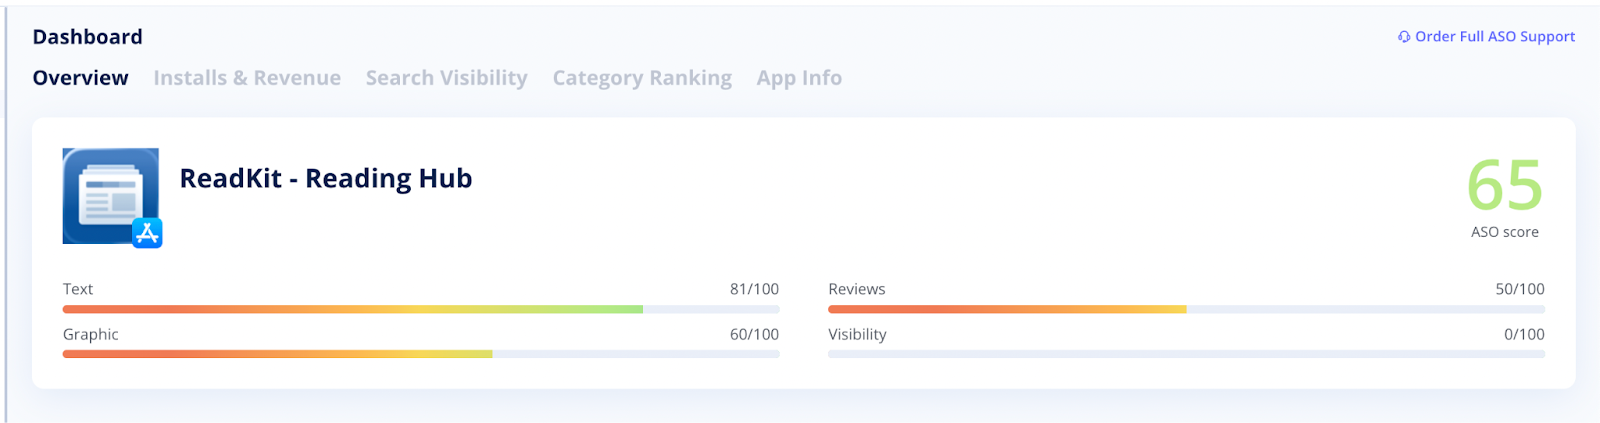
The header contains information about your current ASO score and estimation of the app's texts, graphics, reviews, and visibility effectiveness. Scores range from 0 to 100, where 100 is the strongest.
Screenshots
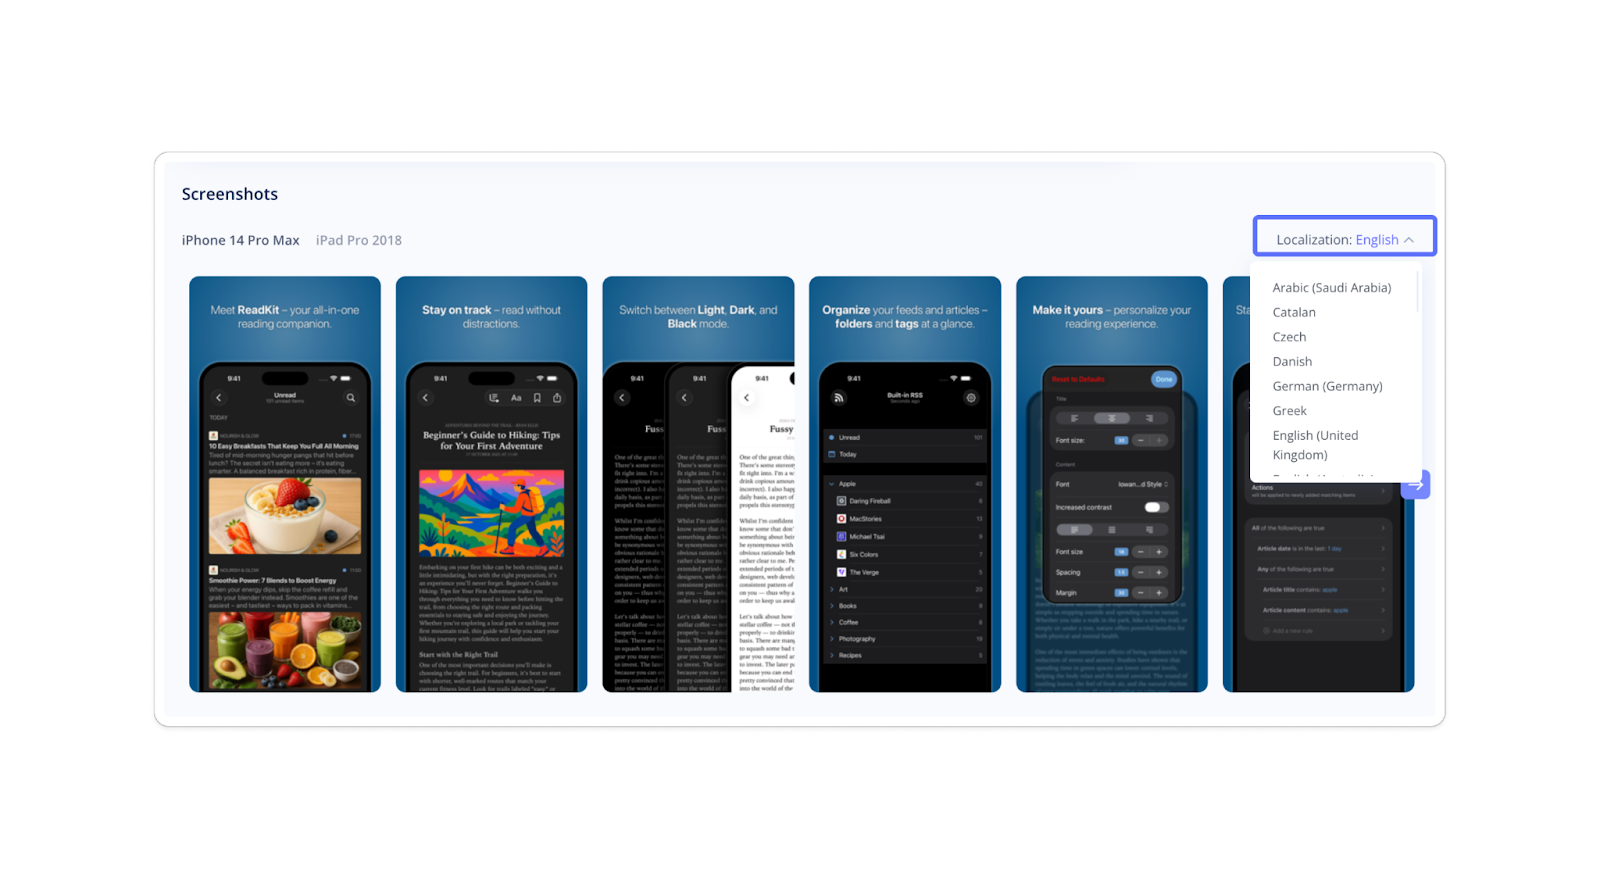
Right under the header, you can view your app's screenshots across all available localizations. On the right side, a dropdown menu lets you select a specific language or country to visually analyze how your app appears in different markets.
Since users in different regions have unique visual and cultural preferences, a "one-size-fits-all" approach may reduce conversions. Reviewing localized versions helps ensure your visuals are culturally relevant and linguistically accurate. Besides, you'll build user trust by showing that your app truly "speaks their language."
Tip: Use this section to quickly identify localization or design inconsistencies that might affect conversion rates.
 Text Metadata
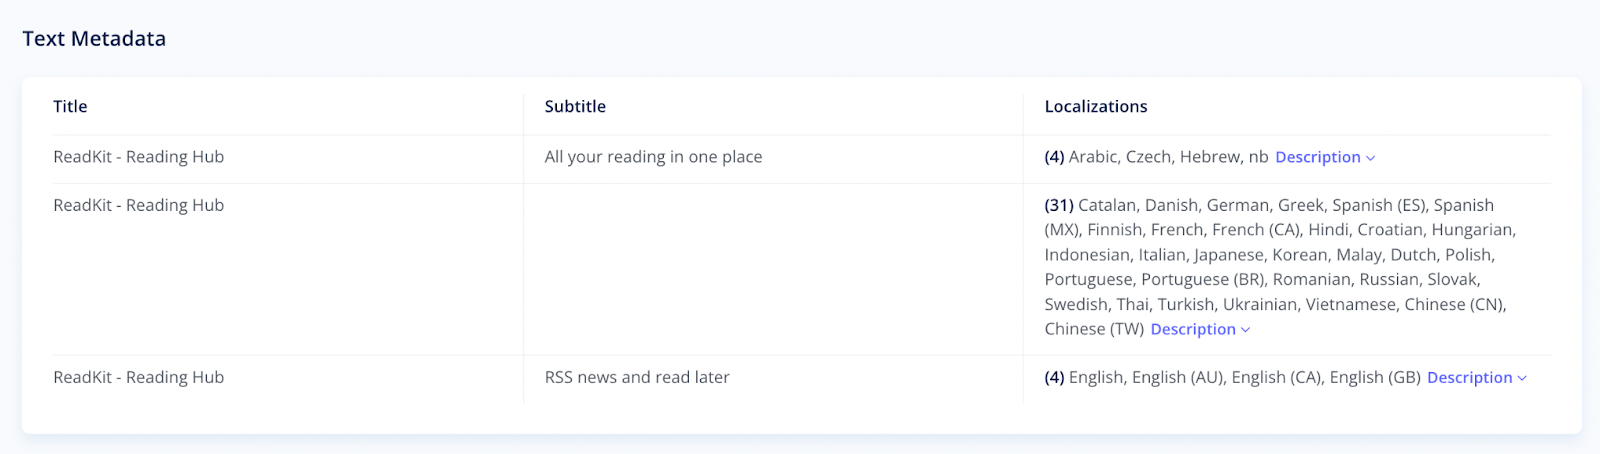
This table shows how your metadata looks across all countries and languages where your app is available. Here, you'll find:
- The localized app name as it appears in the store.
- The short summary users see before expanding the full app description.
- The list of available localizations with links to their corresponding full descriptions.
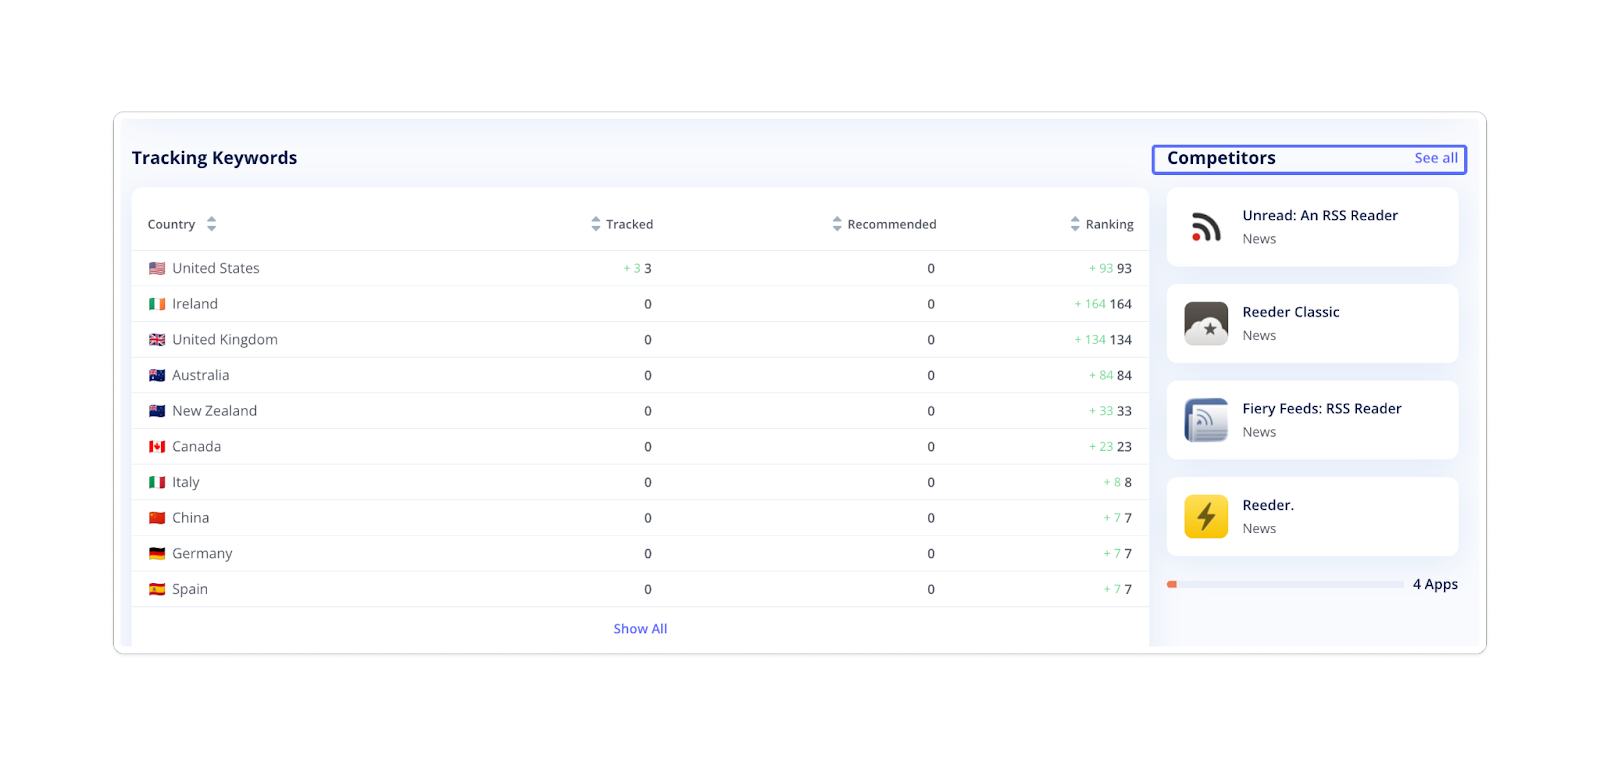
Tracking Keywords
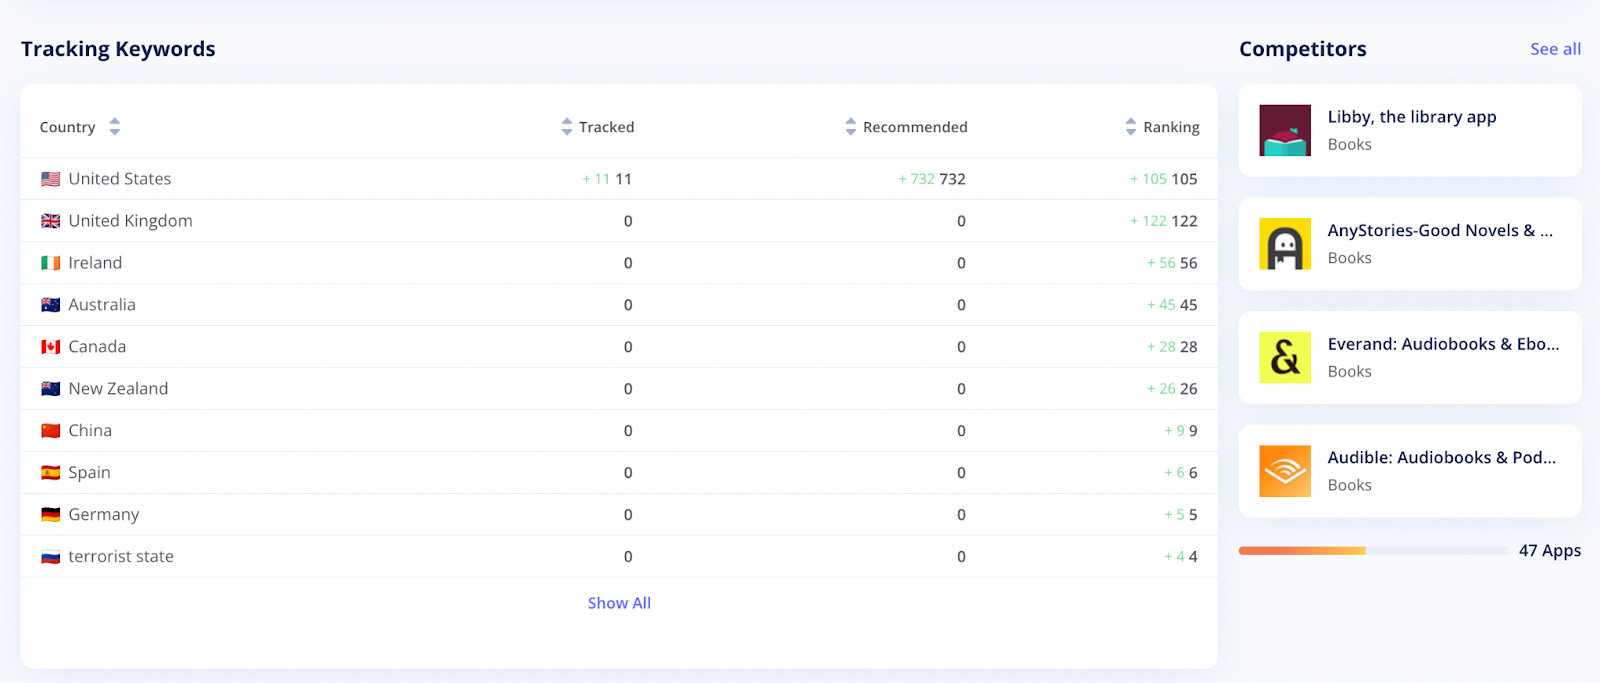
This is a quick overview of the Tracking tool data. Here you can see the number of keywords you have added to the Keywords Tracker, grouped by country, along with the total number of keywords your app is ranked for.
Also, you'll see the number of recommended keywords to use for your app's optimization in a particular country. Click on any tab element to switch to the full version of the tool.
Competitors
To the right of the Tracking Keywords table, you'll find a quick overview of the Competitors tool. This section displays the apps you've marked as your competitors. Click "See all" to switch to the full version of the tool.
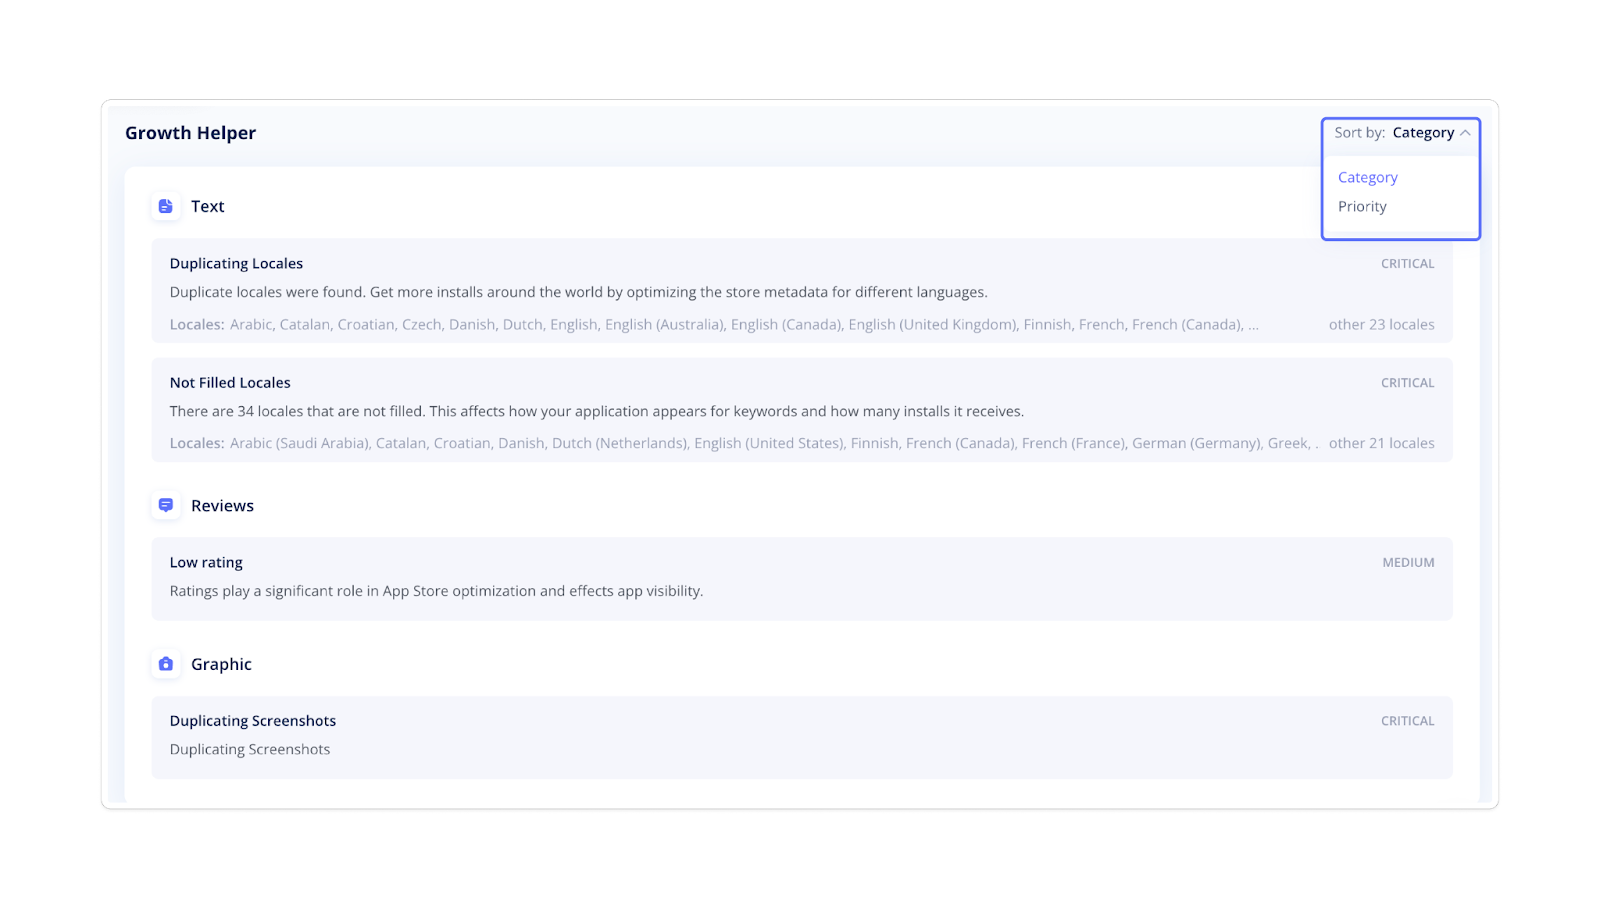
Growth Helper
The Growth Helper automatically detects issues in your app's optimization, including text, reviews, and graphics, and highlights the locales where they occur. It also provides actionable advice on how to fix them.
You can sort the detected issues by category (e.g., text or graphic) or by priority (e.g., critical).
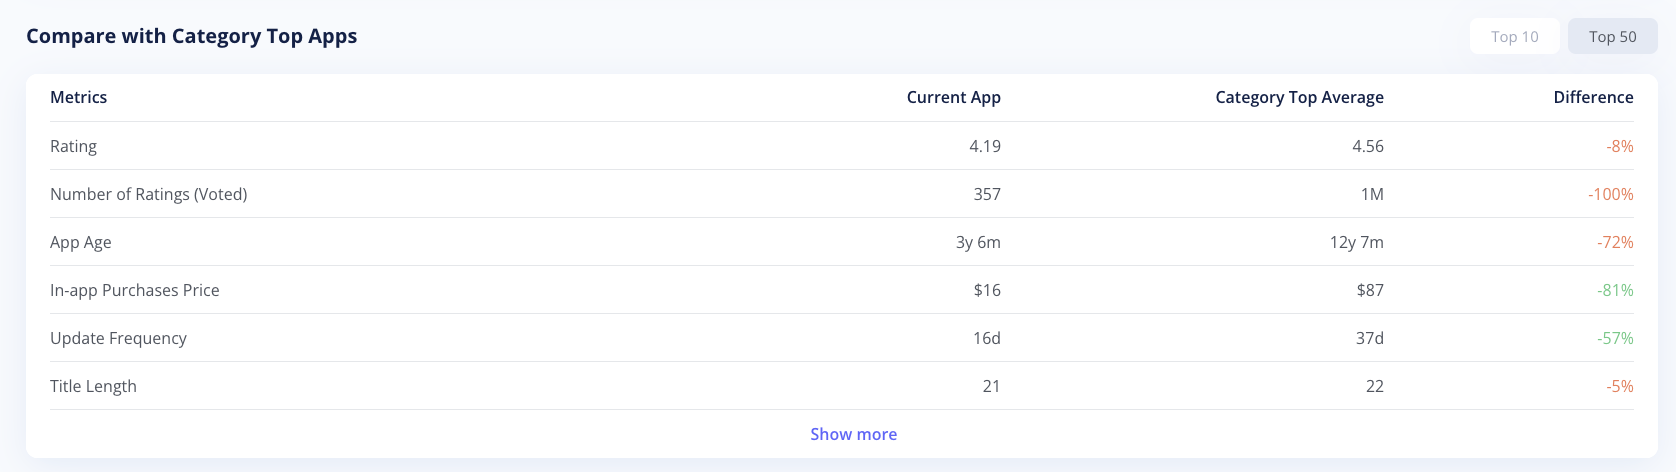
 Compare with Category Top Apps
This section lets you compare ten key performance metrics of your app with the average values of the top 10 or top 50 apps in the same category. Review these comparisons to quickly assess how your app performs against leading competitors and find areas for improvement.
Click "Show more" to open all ten metrics.
2. Installs & Revenue
This tab displays data on your app's installs and revenue across different countries and time periods. It helps you track overall performance, compare global and local results, and identify growth trends.
The Installs & Revenue tab consists of the following sections:
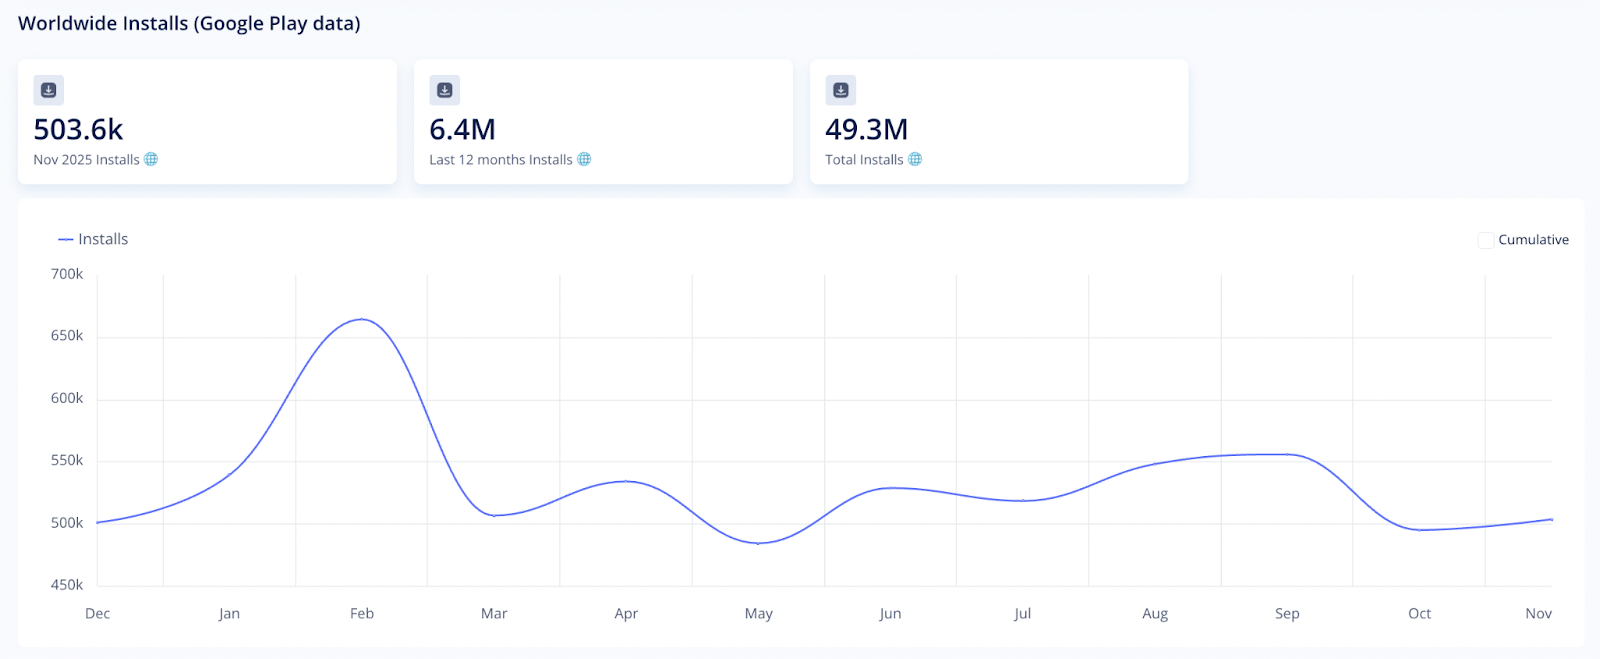
Worldwide Installs (available for Google Play)
This section shows your app's total installs for the current month, the last 12 months, and overall. You'll also see a chart showing how the number changed over the year. It lets you spot growth trends, seasonal fluctuations, and potential performance drops.
By analyzing these patterns, you can see how factors such as marketing campaigns, app updates, or ASO influence user acquisition over time.
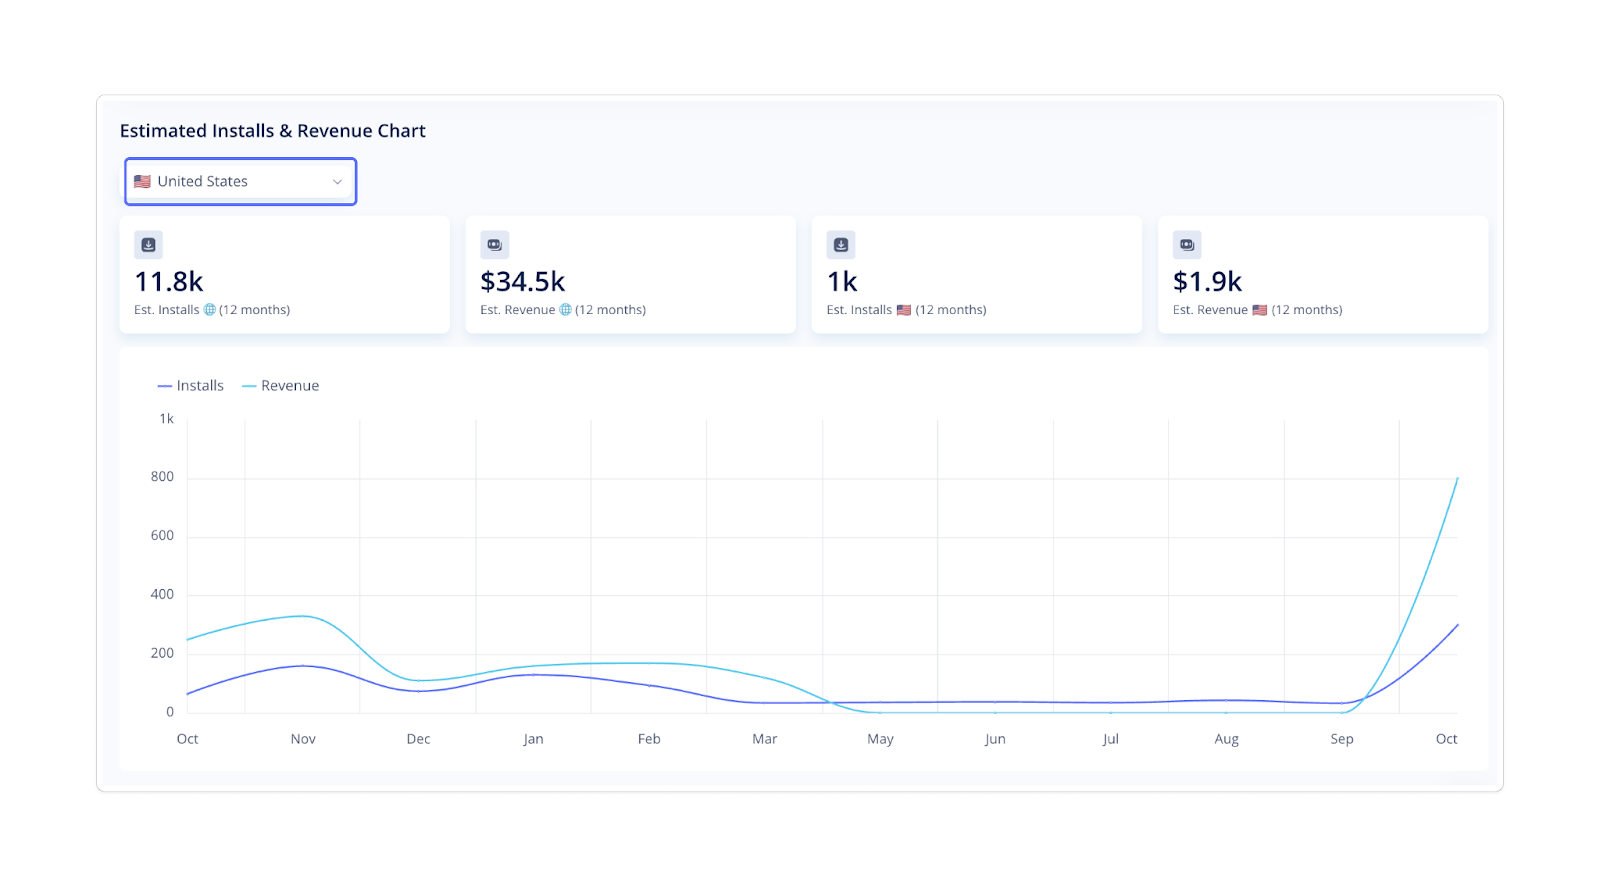
Estimated Installs & Revenue Chart
Here, you can view estimated installs and revenue over recent months for a selected country. The line chart illustrates the monthly dynamics for both metrics. Use the country dropdown menu to switch regions and analyze performance across markets.
The legend above the chart indicates which line corresponds to installs and which to revenue. Clicking on either label hides or shows that line and allows you to focus on one metric at a time.
 Estimated Installs & Revenue for the Previous Month
Below the chart, you'll find a table with a detailed country breakdown for the previous month. It displays the following details:
- Market where your app is available
- Estimated installs from each country
- Country's share of total installs
- Estimated revenue generated in that market
- Country's share of total revenue
This data reveals which countries contribute most to your user base and income. For instance, a market with many installs but low revenue may require improving monetization or localization strategies.
3. Search Visibility
This section provides a quick overview of your app's visibility for keywords in the selected country. It shows how many keywords your app ranks for and how their positions change (up or down).
- Total Keywords displays the number of keywords your app currently ranks for.
- Visibility reflects how easily users can discover your app. It's based on the average estimation of Popularity and App Rank metrics. Ranking for more popular keywords and having a high app rank increases visibility. For example, an app with a visibility score of 10000 is more likely to be noticed than one with 1000, which ranks for less popular keywords.
- Keywords Movements show how many keywords were found (new), excluded (dropped out), got higher positions (improved), or got lower positions (decreased) during the previous day compared to the day before. Red and green numbers visualize these daily dynamics. The data is based on Total Keywords.
- Keyword Breakdown shows how many keywords from the whole list are used by Top apps (Top 1, Top 2-5, etc.). Red and green numbers indicate how many keywords have entered or dropped out of these top positions.
- Rank up and Rank down show how your app's position changed for each keyword. Green and red numbers indicate whether the position increased or decreased. Black numbers show your current ranking for the keyword. The data is sourced from the Keywords Tracking tool.
If you want to continue working with keywords, switch to the tool by clicking "Go to Ranking Keyword."
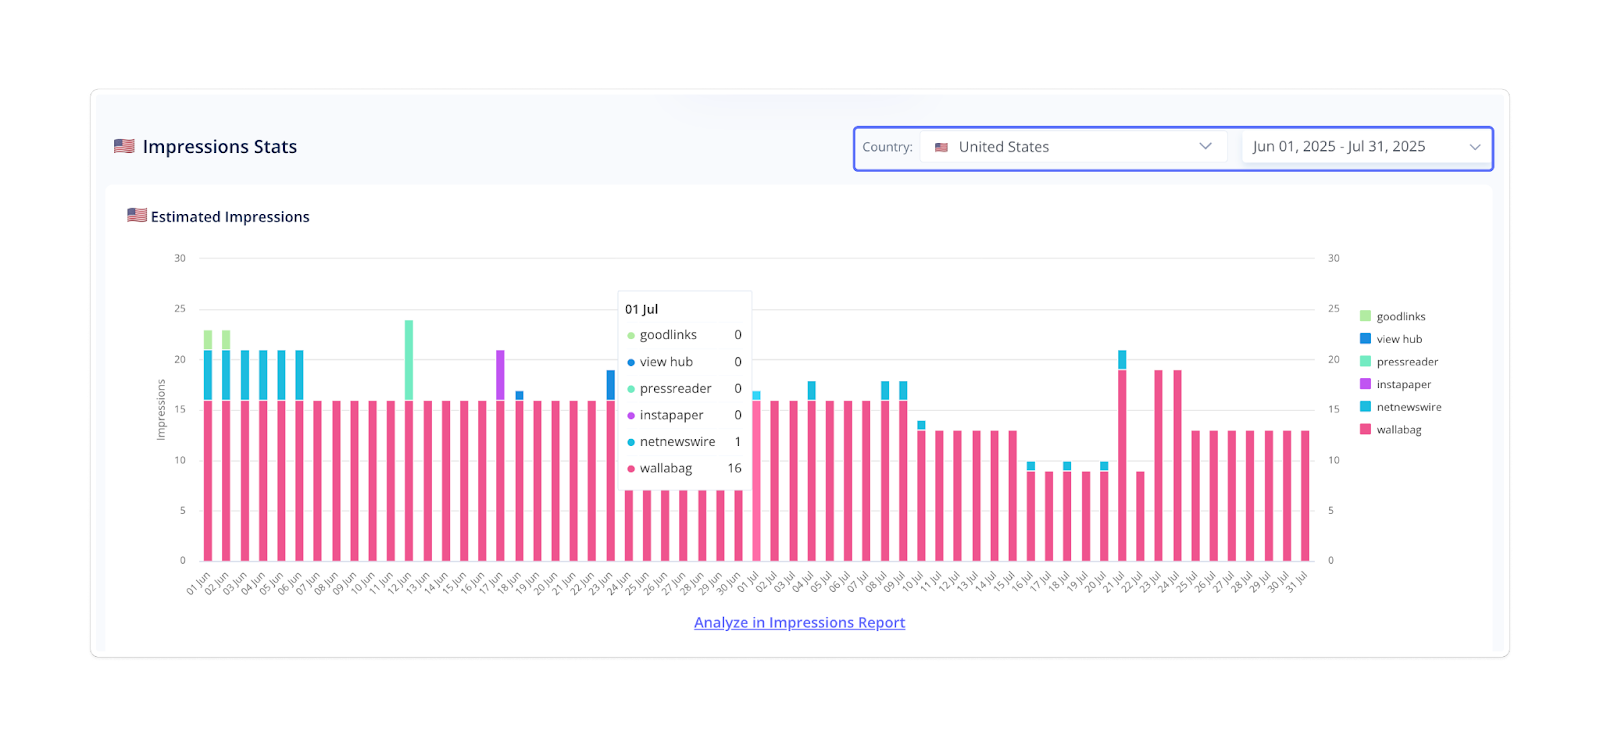
Impressions Stats
This section shows how your app's impressions change across countries and over time. Use the dropdown menus at the top of the chart to select specific countries and date ranges. You can view data for a single country, multiple countries, or worldwide.
The chart helps you identify which keywords generated the most search impressions during the selected period. Moreover, it allows you to spot patterns and understand where your app attracts the most visibility.
For a deeper analysis, go to "Impressions Report."
4. Category Ranking
In the Category Ranking tab, you'll find information on how your app performs in its selected categories across different countries and devices. It provides insight into your app's standing among competitors and how this position changes over time. The section includes three main parts:
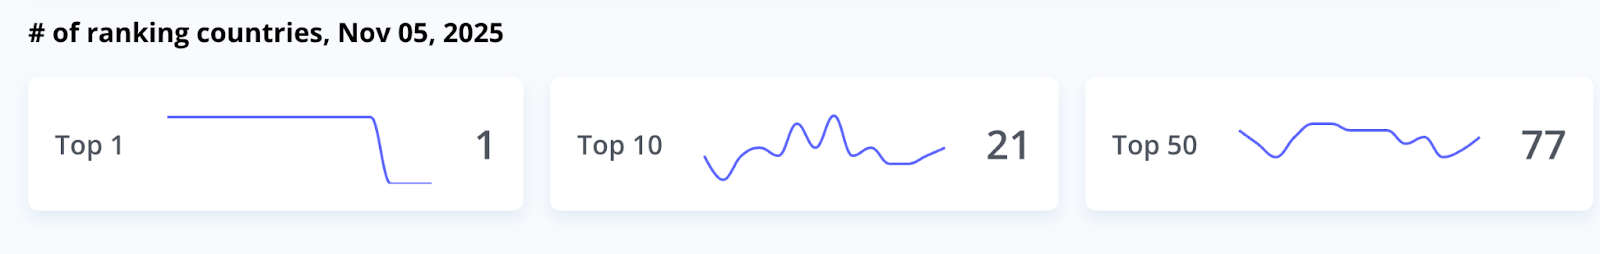
# of Ranking Countries
This section contains the following 3 charts:
- Top 1 – number of countries where your app holds the #1 position in its category across a specific period.
- Top 10 – number of countries where your app appears in the top ten across a specific period.
- Top 50 – number of countries where your app is ranked among the top fifty apps across a specific period.
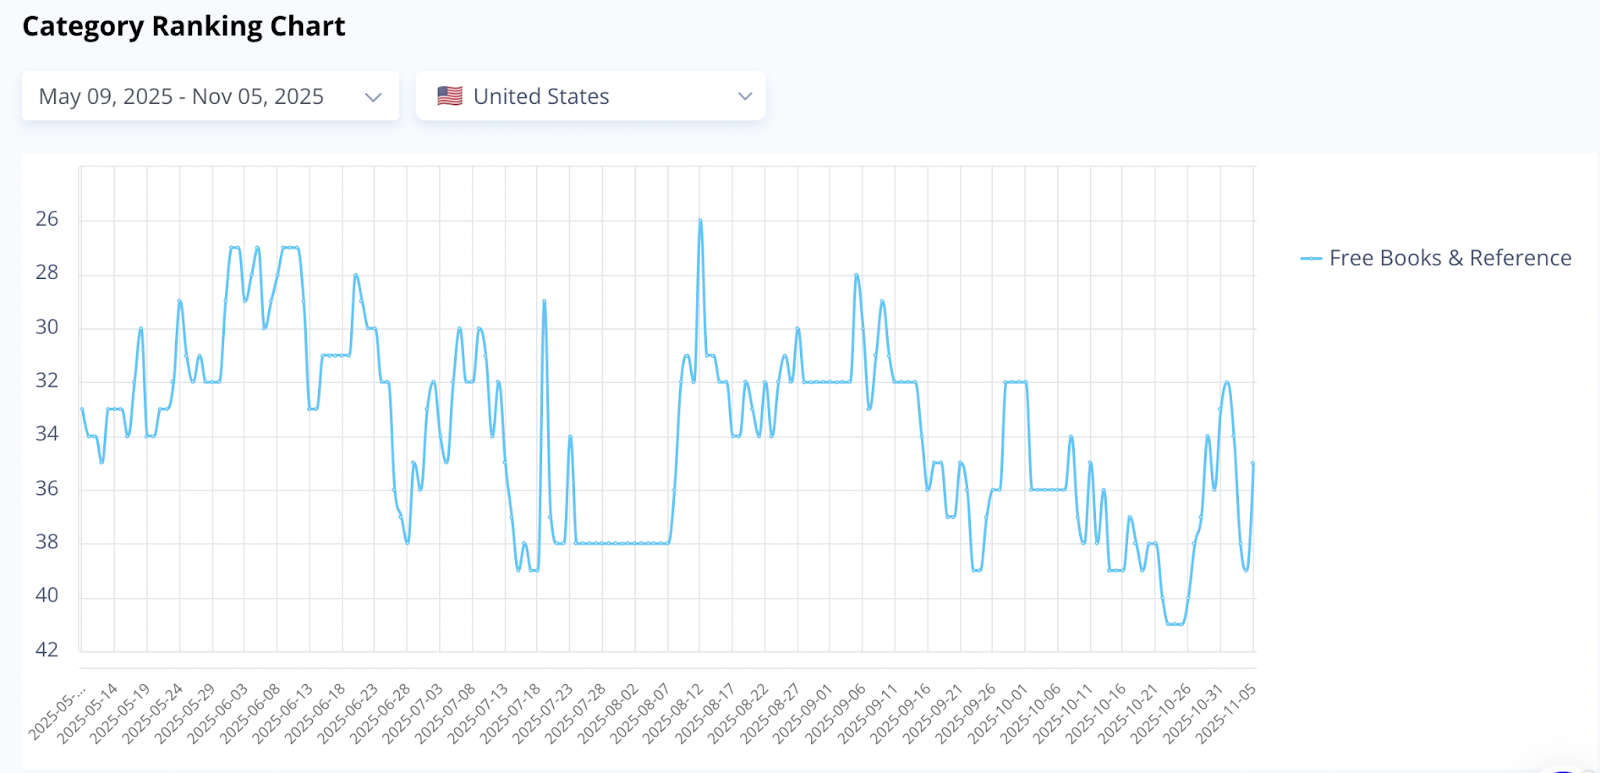
Category Ranking Chart
This line chart visualizes how your positions change over time within specific categories. It includes several trend lines:
For example, your app appears in Free Social, Grossing Social, and Free Overall categories.
- Free Social: your app's rank among free apps in the Social category.
- Grossing Social: your app's rank based on revenue within the same category.
- Free Overall: your app's rank among all free apps, regardless of category.
To focus on specific time periods or regions, use the date and country dropdowns above the chart. The legend to the right of the chart shows which line corresponds to which metric. You can click on a label to hide or display that line.
Category Ranking Table
This table provides a detailed view of your app's category positions across countries and how these rankings have changed compared to the day before. Use the dropdown lists above the chart to filter data by specific countries or categories.
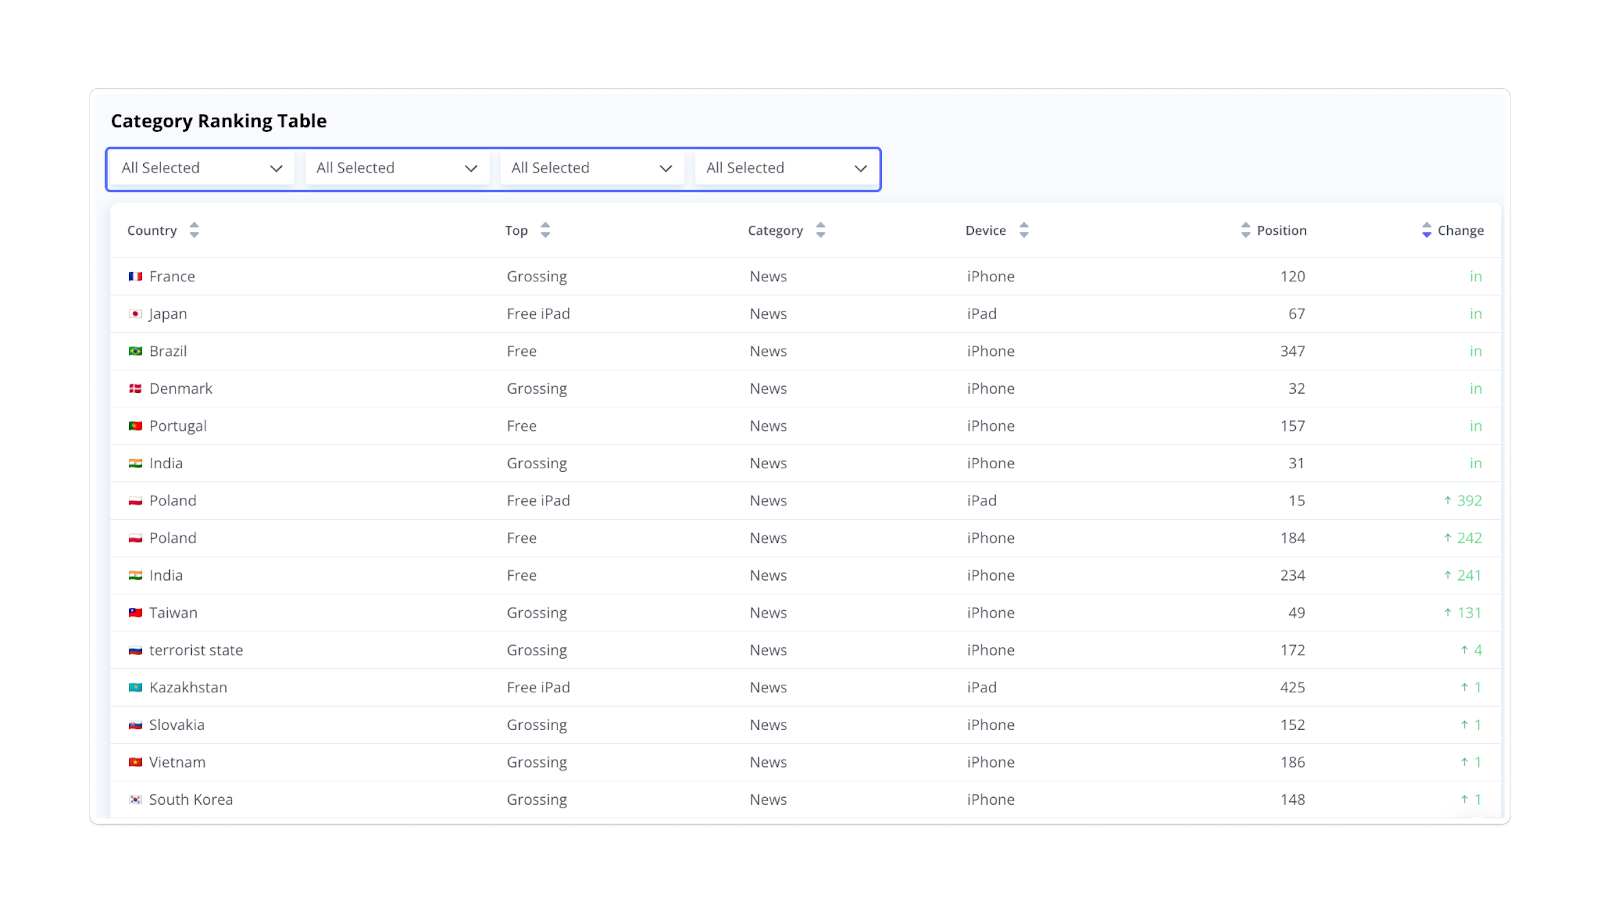
Together, the chart and table help you track your app's category performance over time and evaluate the impact of your regional marketing efforts.
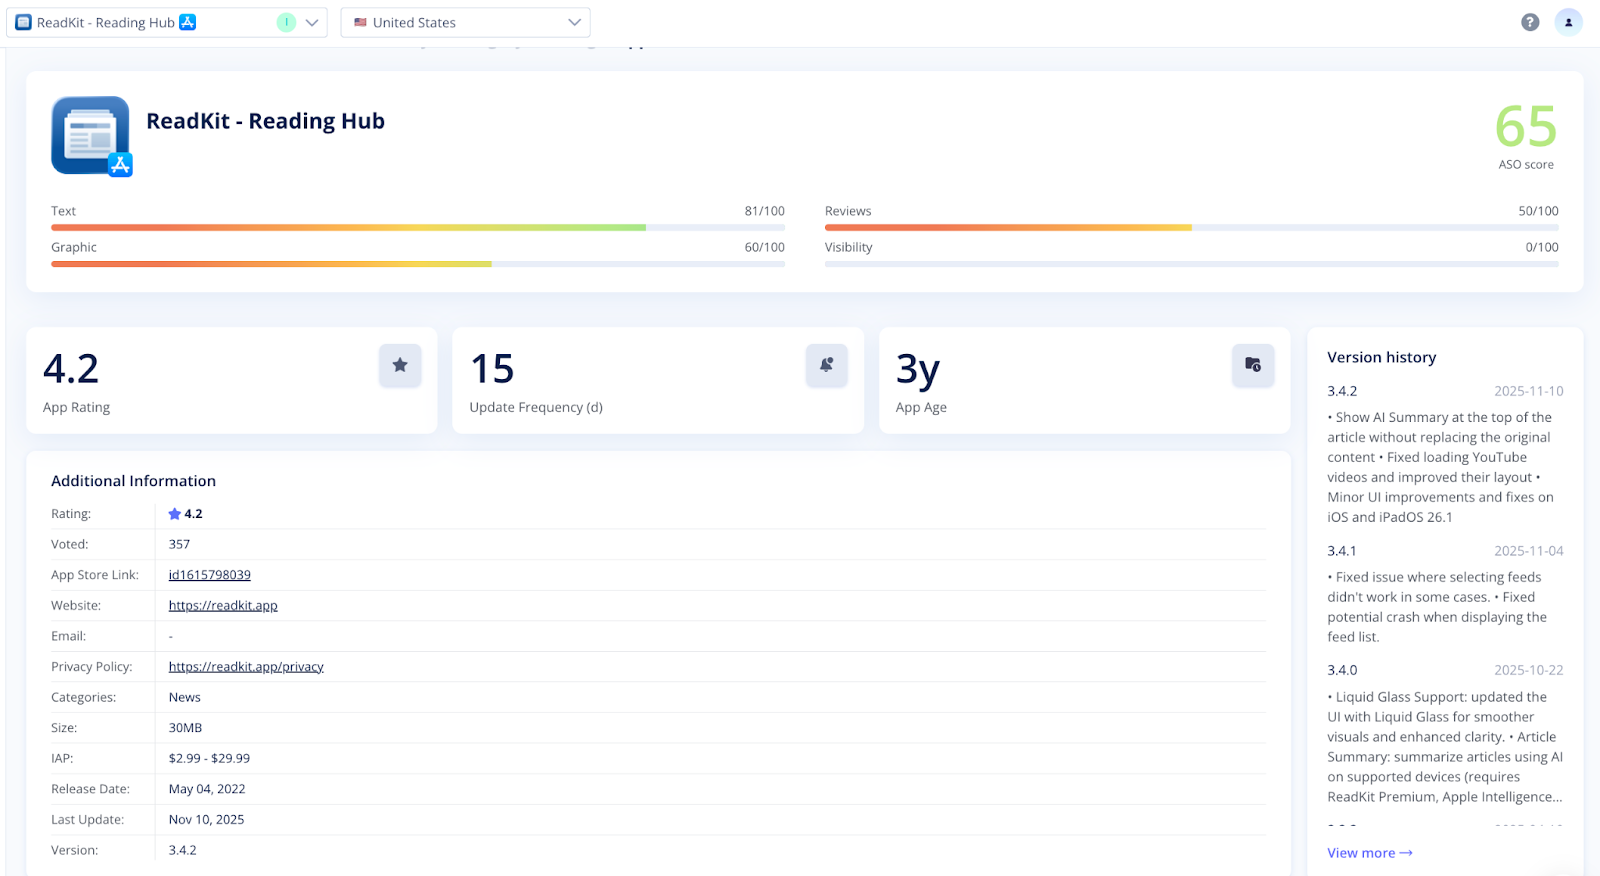
5. App Info
The App Info section provides key details about your app, including its rating, update frequency (in days), age, version history, and other general data from the app store page.
Dashboard gives a quick overview of the app's overall optimization efficacy and highlights areas that need improvement. For a deeper analysis, you can switch to the dedicated ASO tools.