
Keyword Analyzer
The Keyword Analyzer tool provides detailed performance data for a specific keyword. It helps you decide whether you should add a keyword to your Tracking list (your semantic core) and use it for app optimization. In this tool, you have access to multiple Asolytics keyword instruments in a compact form – all the data about a specific keyword in one place.
Why to use: Detailed study of a specific keyword.
Goal: Determine the effectiveness of a keyword for your app's semantic core.
Time: Up to 5 minutes.
Use the Keyword Analyzer to understand a keyword's potential before adding it to your tracking list. This helps you focus on keywords that can improve your app's visibility and ranking.
1. Choose a Keyword
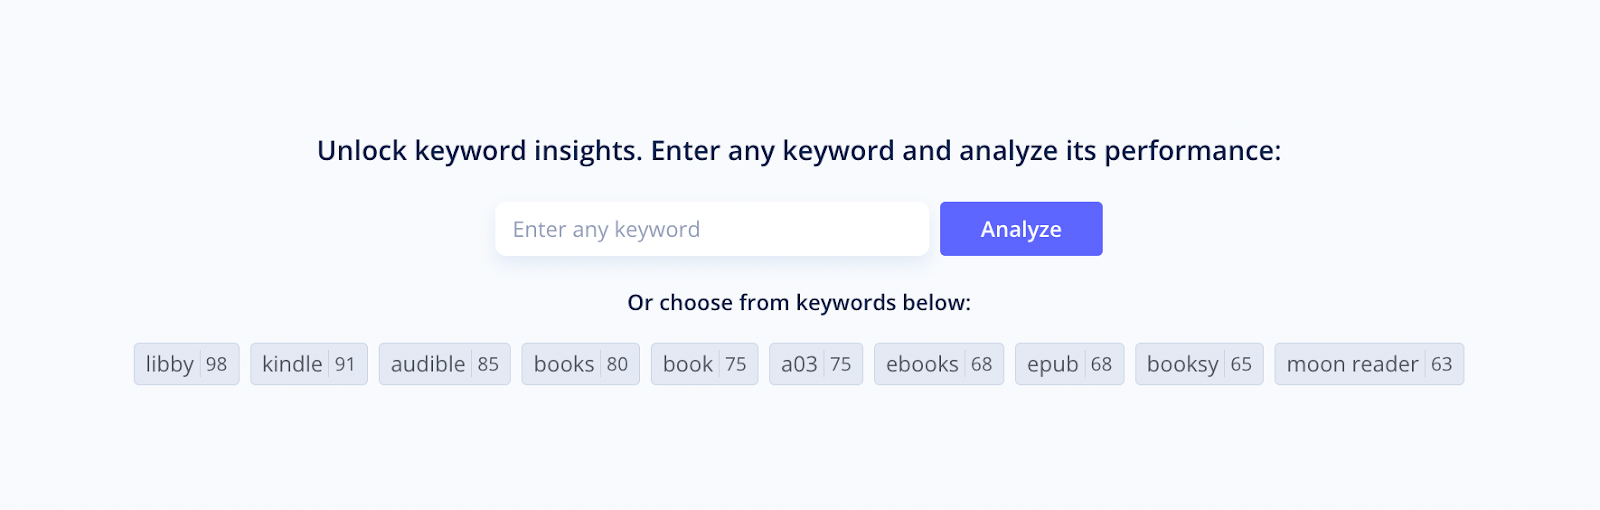
To get started with Keyword Analyzer, type a keyword into the search bar and click Analyze. You can also select one of the suggested options from the keyword cloud below, which contains terms from your Tracking Keywords list.
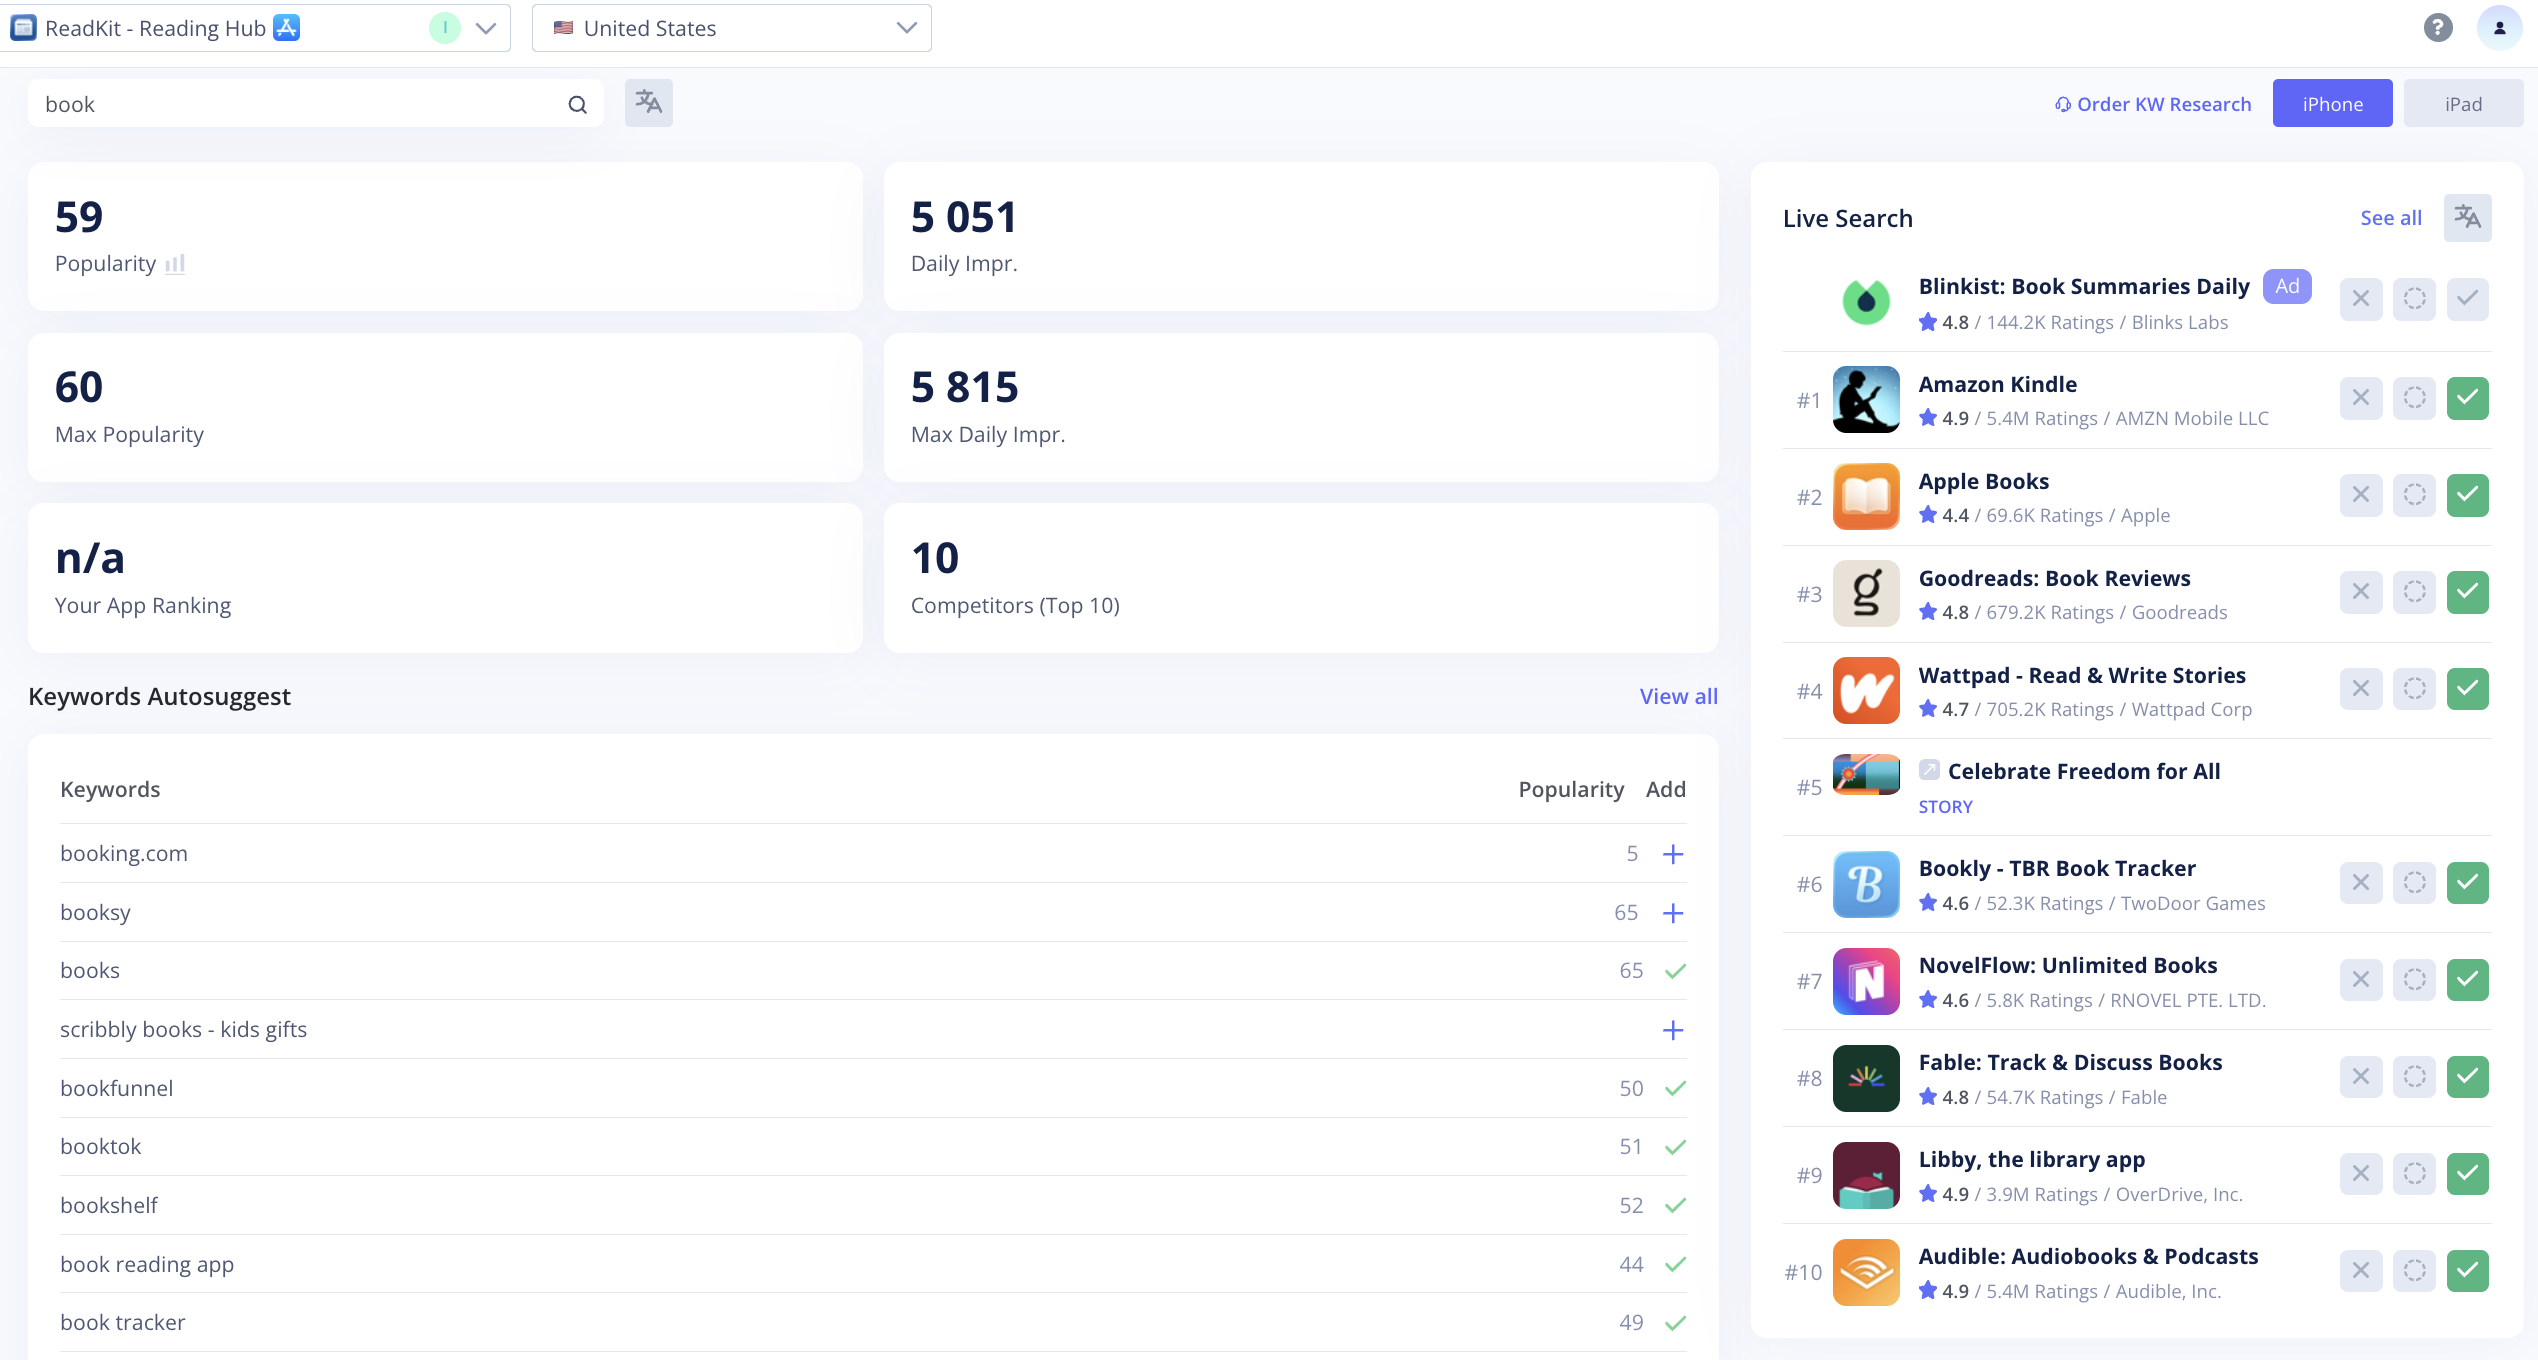
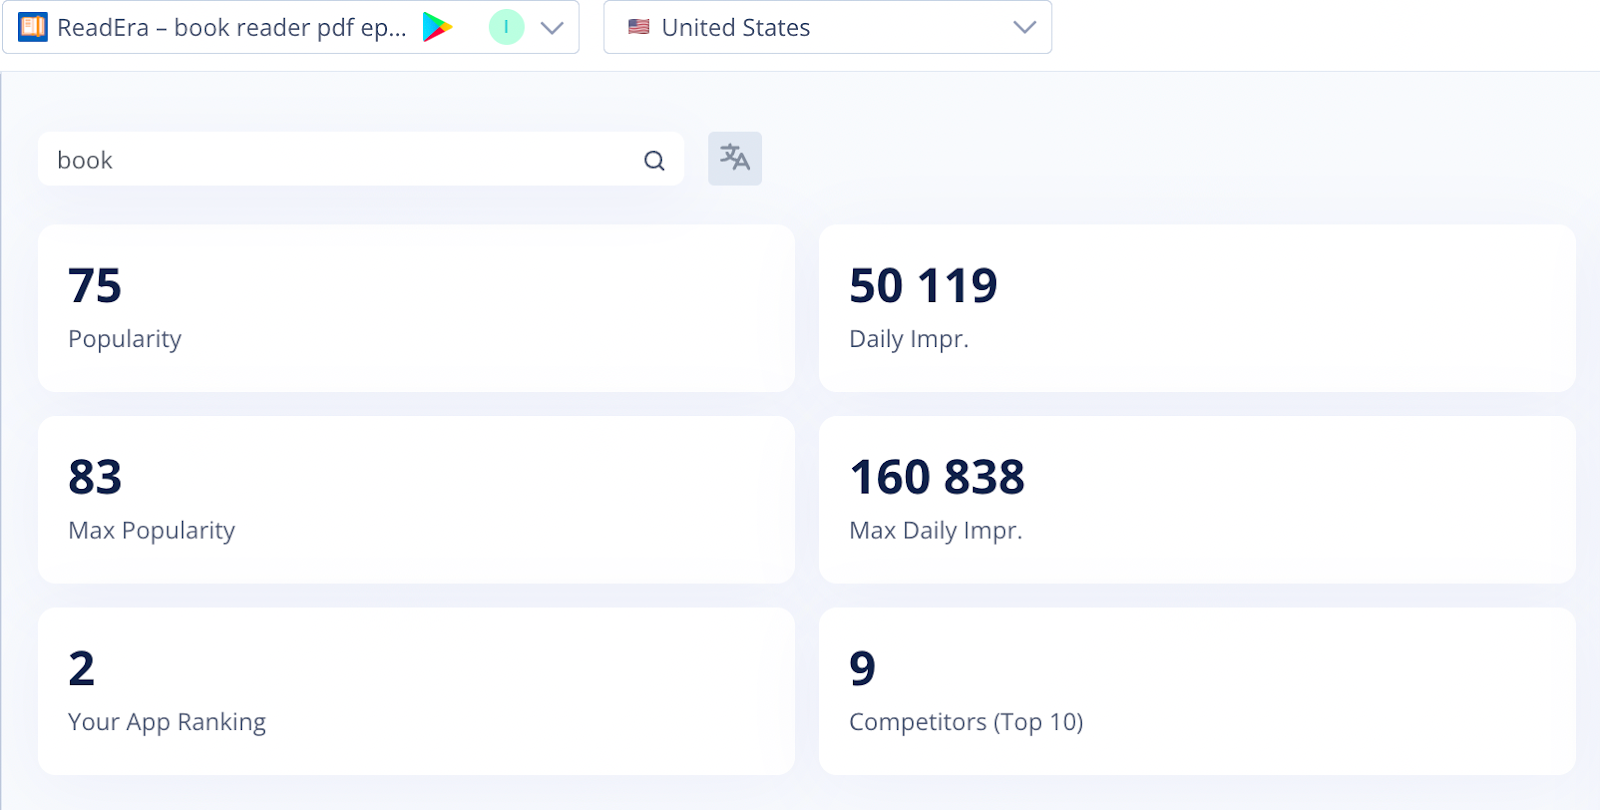
If you're studying a keyword for the app from the App Store, Asolytics provides separate keyword data for iPhone and iPad. By default, data is displayed for iPhone, but you can switch to iPad in the upper-right corner of the screen. For Google Play, app data is shown as a single set for all devices.
You can also translate a keyword you analyze into English by clicking the appropriate button.
2. Analyze the Keyword
Performance
View the keyword's performance across the following parameters:
- Popularity shows the estimated rate for the keyword, depending on how often people use this keyword to search for the app.
- Max Popularity displays the highest recorded popularity value for this keyword.
- Daily Impressions indicates how many times apps appear in search results for this keyword per day.
- Max Daily Impressions shows the highest number of daily impressions the keyword has reached.
- Your App Ranking shows your app's current position for the selected keyword.
- Competitors (Top-10) include apps from the top 10 for this keyword.
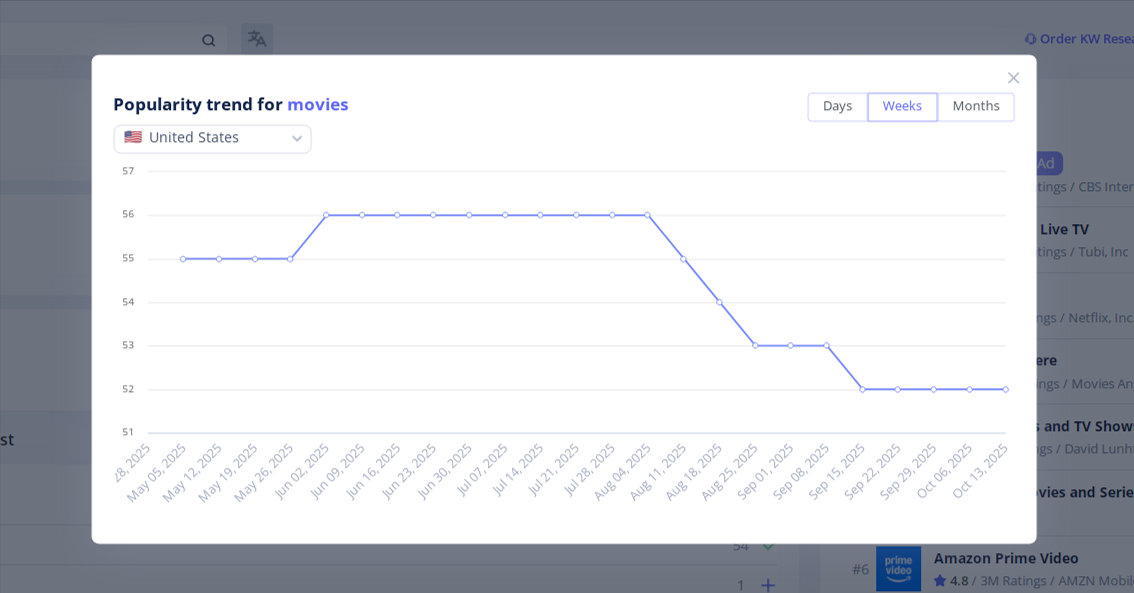
To take a closer look at keyword popularity changes, click the icon next to the metric name to open the Popularity Chart. Specify a country and a time period, then hover over the desired date to see the exact data and track popularity dynamics.
Live Search
The Live Search section shows the apps that rank for the selected keyword. Here, you can see the top 10 apps that appear in the store when users search for that word or phrase.
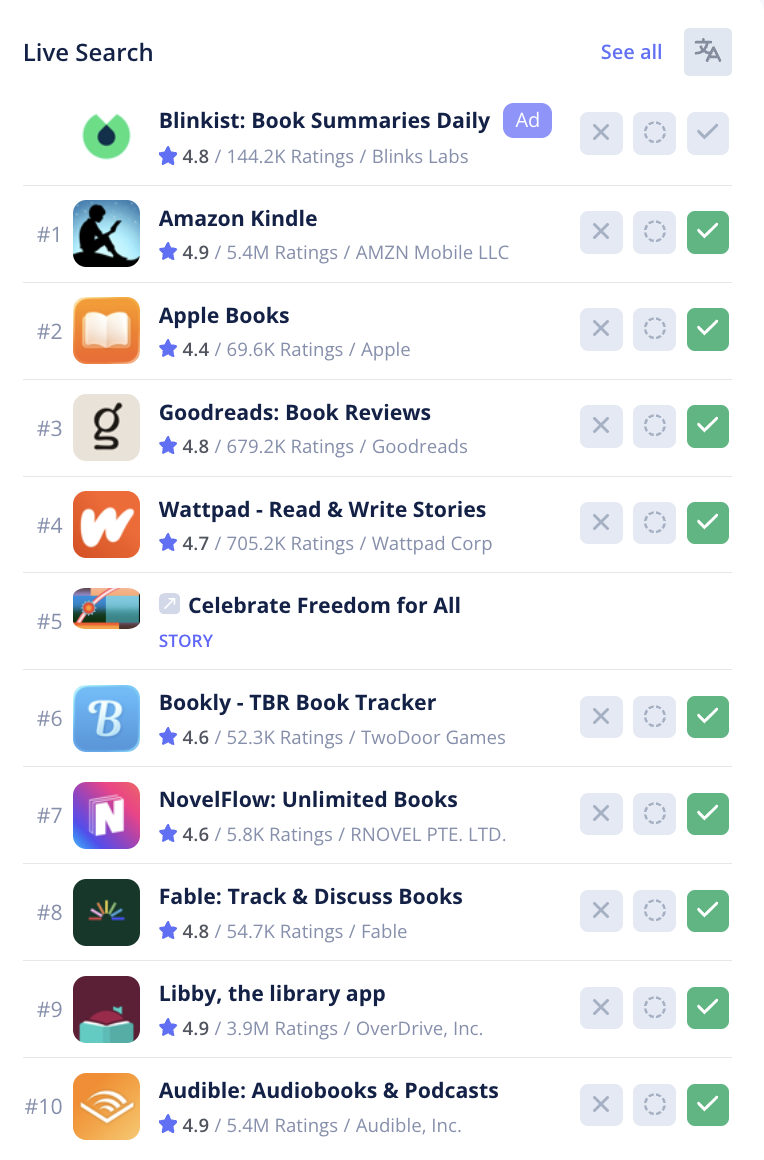
Click an app's title to review its basic metadata. You can also mark any app as a competitor, indirect competitor, or non-competitor for easier comparison. For more information, click See All to open the full version of this tool. If you need to translate an app’s title into English, click the Translate button.
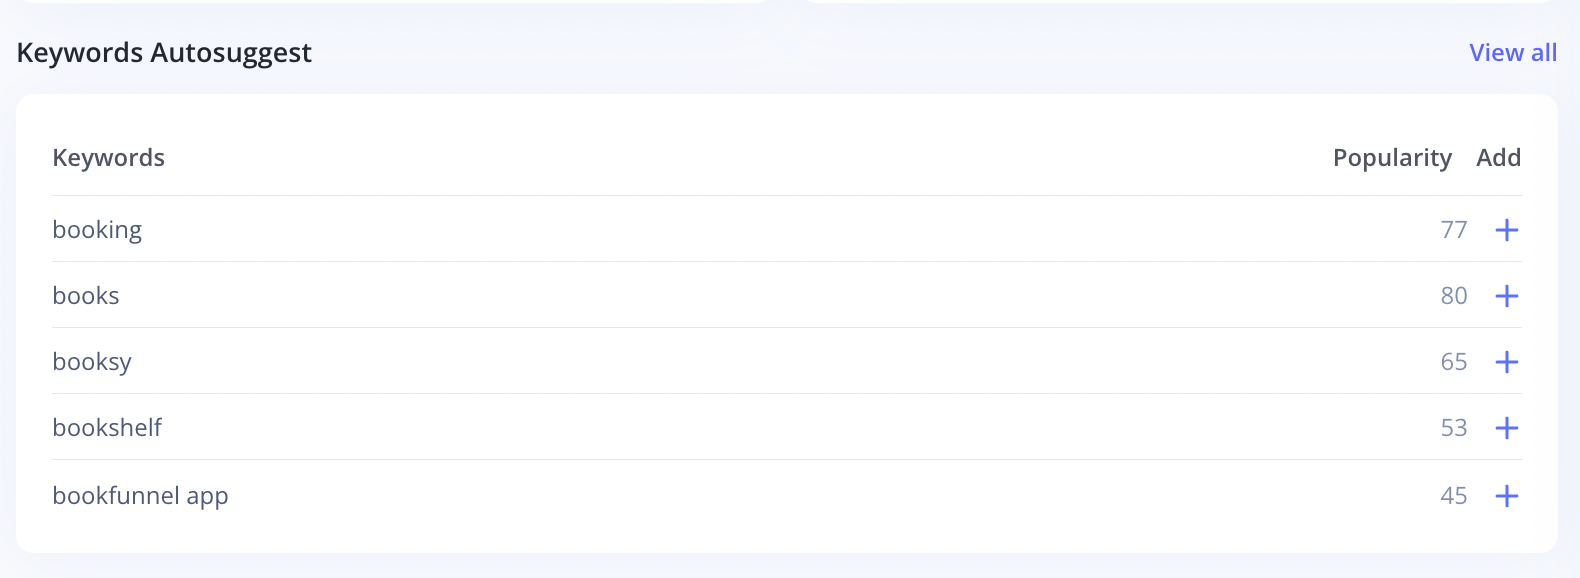
Keywords Autosuggest
The Keywords Autosuggest section shows what search suggestions users see when they start typing a keyword in the app store search bar. These are the most popular related queries based on real user behavior.
You can translate any keyword using Google Translate, add it directly to your Keyword Tracking list, and see which keywords you are already tracking. To access the full list, click View All to open the full version of this tool.
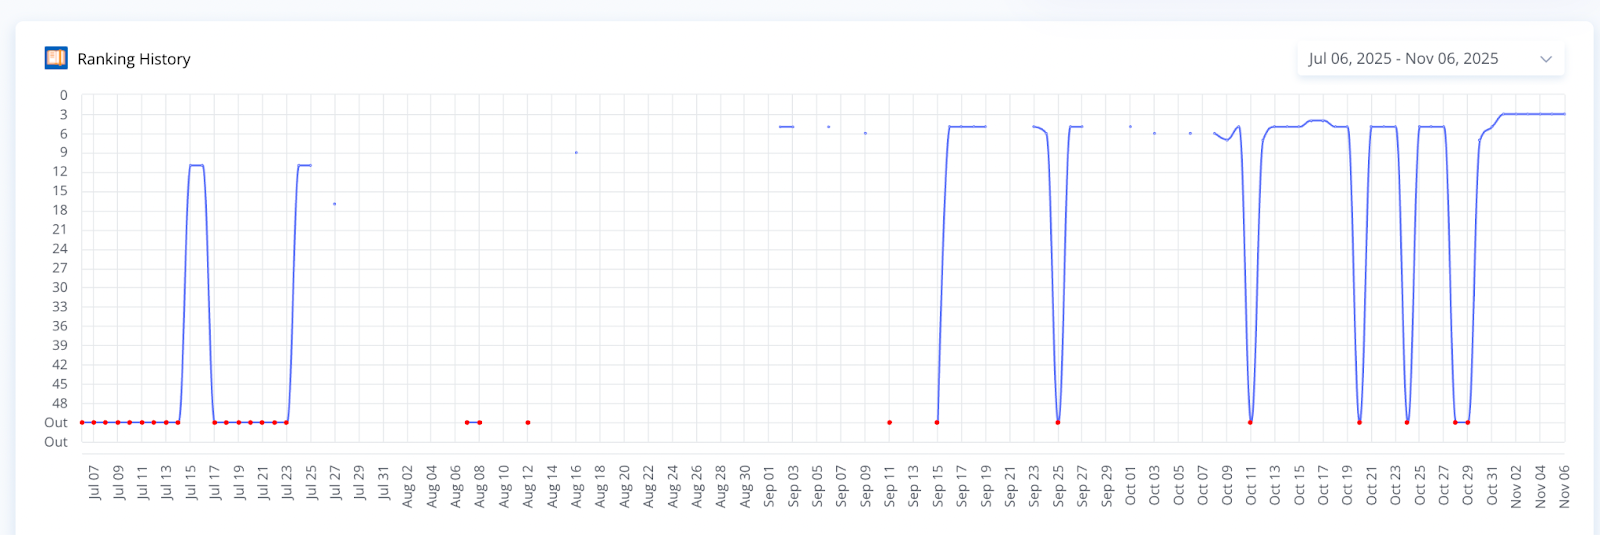
Ranking History
The Ranking History chart shows how your app's position for the selected keyword has changed over time. Use it to track ranking fluctuations and evaluate the impact of your optimization efforts or app updates.
You can adjust the date range in the upper-right corner to analyze performance trends for any specific period. Hover over the line to see exact ranking data for each date.
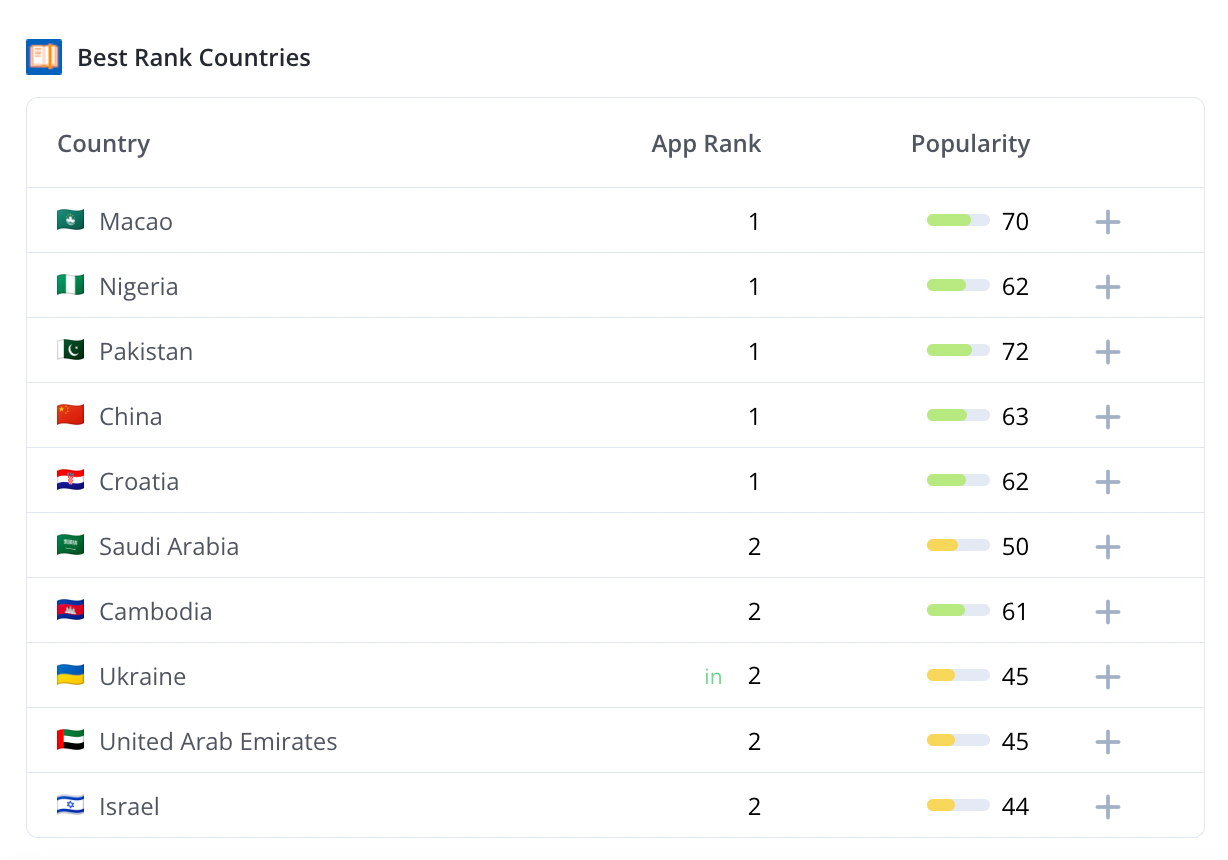
Best Rank Countries
The Best Rank Countries section lists the countries where your app has achieved its highest positions for the selected keyword.
You can compare your App Rank and Popularity across markets to identify regions where your app performs best and where additional optimization may be needed. To explore how the Popularity metric has changed over time for a specific country, click Open Chart.
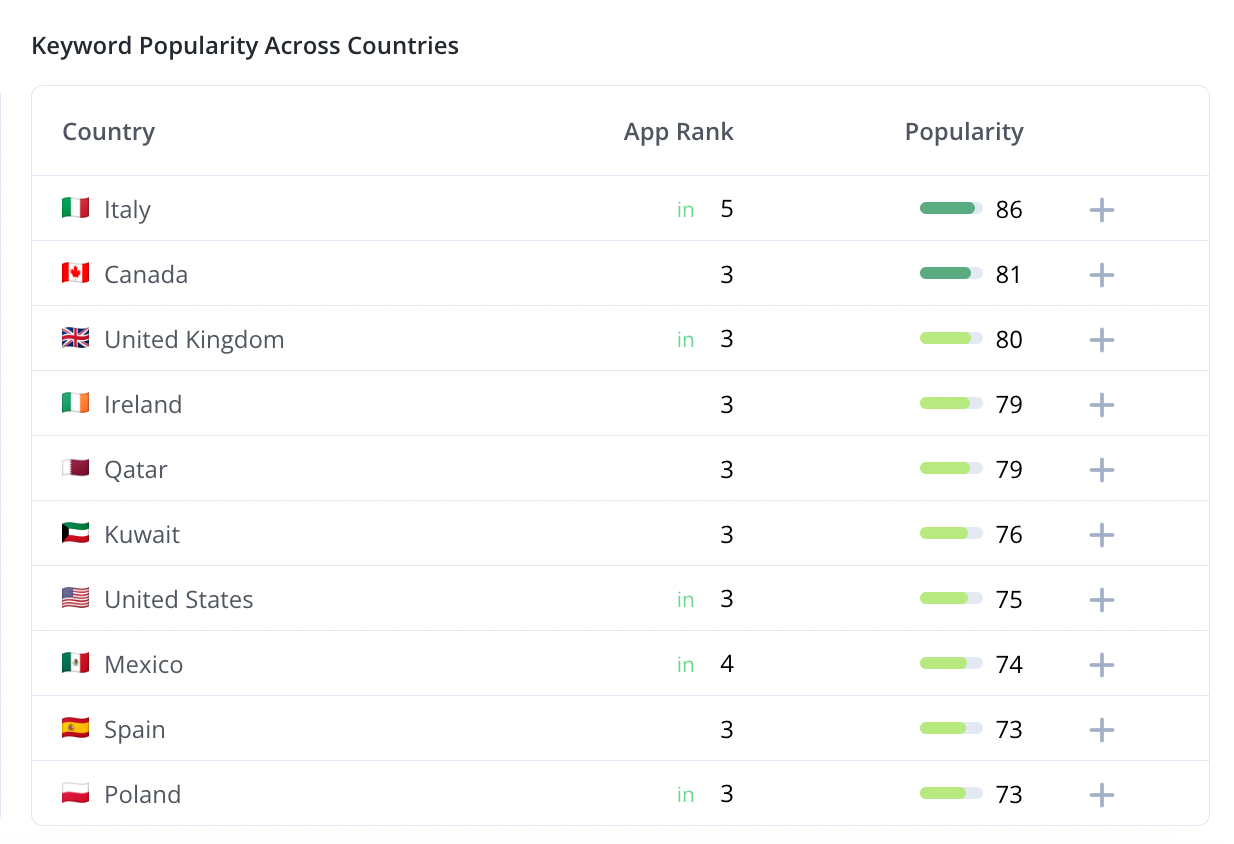
Keyword Popularity Across Countries
The Keyword Popularity Across Countries section displays how popular the selected keyword is in different markets.
Here, you can see the popularity score and your app's rank (if available) in each country. Use this data to discover regions where the keyword has strong potential and decide whether it's worth targeting for further optimization.
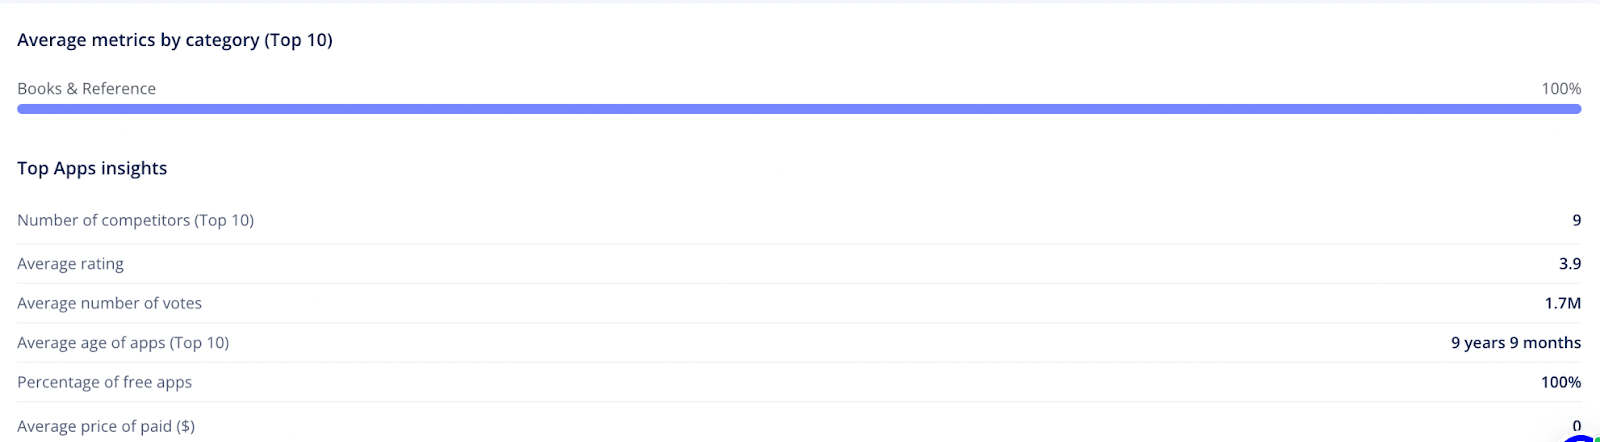
Average Metrics by Category (Top 10)
This section shows how the top 10 apps that rank for the selected keyword are distributed across different categories. The bar chart provides a quick visual representation and makes it easy to see which categories dominate the rankings.

By studying these metrics, you can identify which categories are most competitive for the chosen keyword and spot potential opportunities in less crowded segments.
Top App Insights
These insights can help you compare your app's performance with the averages of competitors' apps for the chosen keyword. Here you can see:
- Number of competitors from the top 10
- Average of their ratings
- Average number of votes
- Average apps' age
- Percentage of free apps
- Average price of paid apps ($)
This way, you can explore any keyword. When you're done with one word or phrase, type another in the top search bar. Afterward, proceed to the next step — studying the search results for a specific keyword using Live Search.